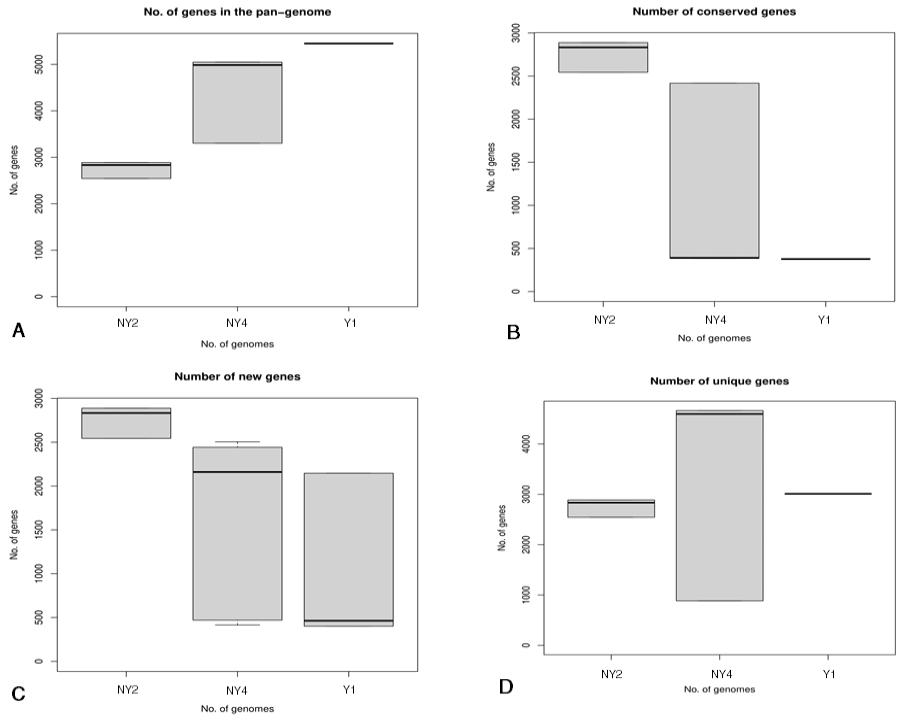
Fig. 5.
Box plots representation of pan genome analysis of the three Lactobacillus casei Group (LCG) strains. (A) Represent the number of genes in pan genome of the three assembled genome (B) Number of conserved genes identified in three assembled genome (C) Number of new genes identified in three assembled genome (D) Number of unique genes identified in three assembled genomes.