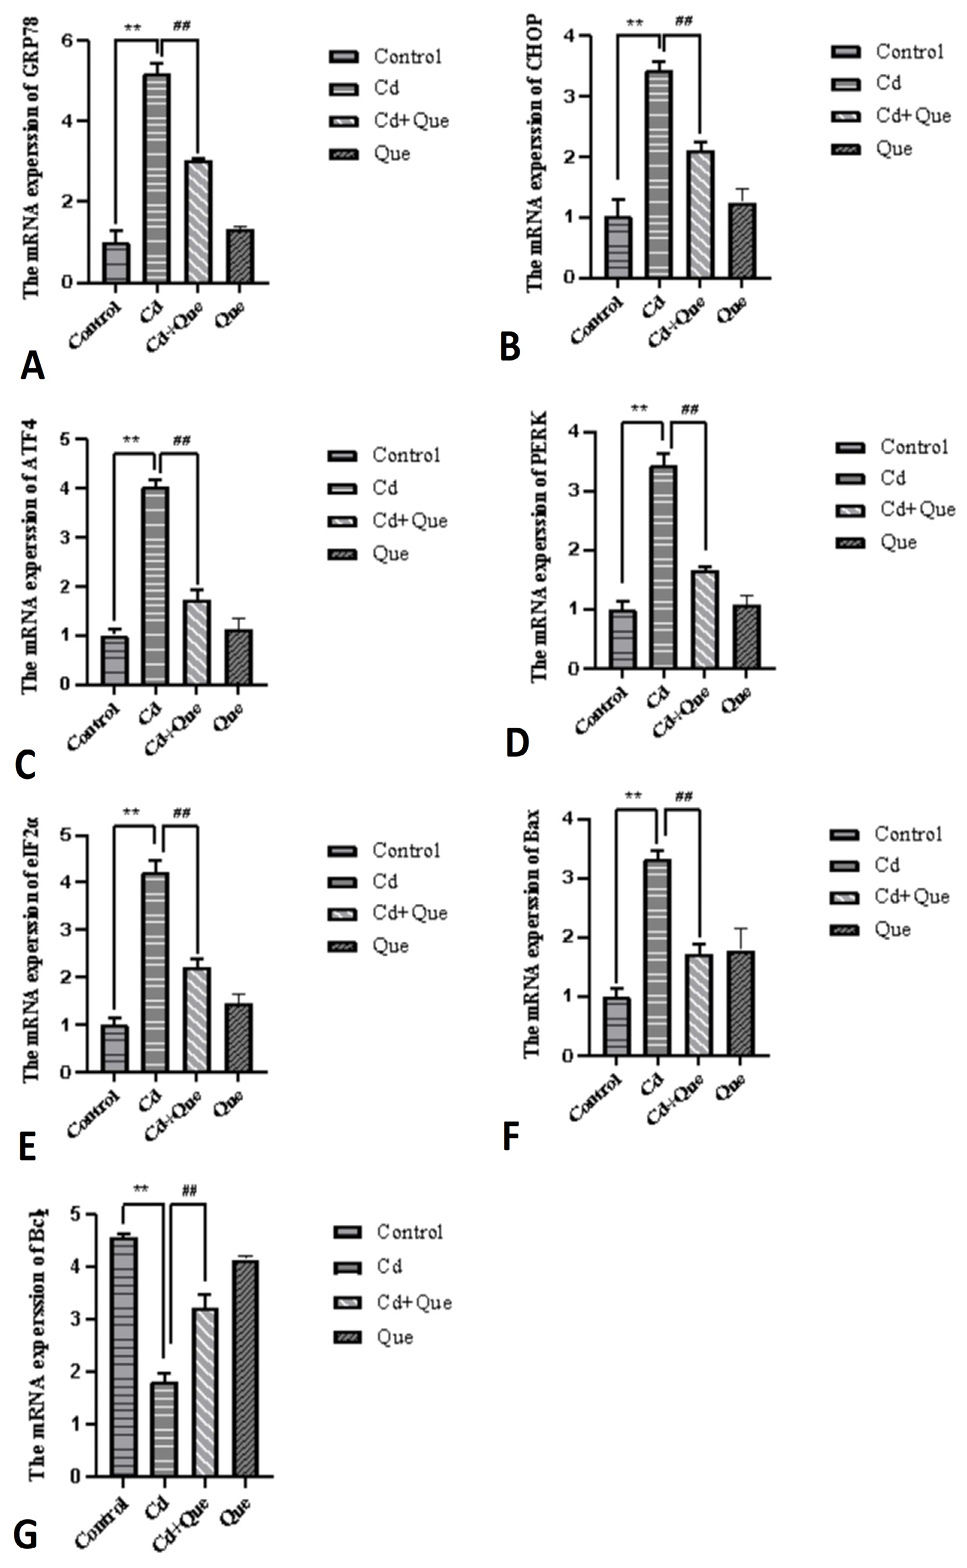
Fig. 3.
Effects of Que on mRNA expression levels of GRP78, CHOP, ATF4, PERK, elF2a, Bax, and Bcl-2. Bars indicate mean ± SEM (n = 3).
Effects of Que on mRNA expression levels of GRP78, CHOP, ATF4, PERK, elF2a, Bax, and Bcl-2. Bars indicate mean ± SEM (n = 3).