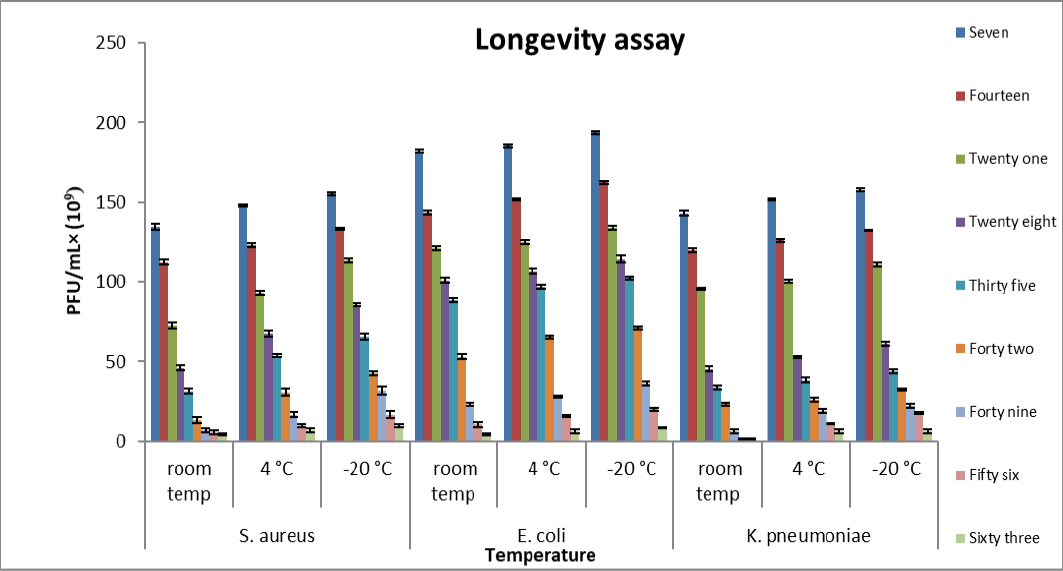
Figure 3:
Histogram showing longevity of S. aureus, E. coli, and K. pneumoniae phages at different temperatures. Data are the means of the three replicates and error bars represent the standard errors of the means.
Histogram showing longevity of S. aureus, E. coli, and K. pneumoniae phages at different temperatures. Data are the means of the three replicates and error bars represent the standard errors of the means.