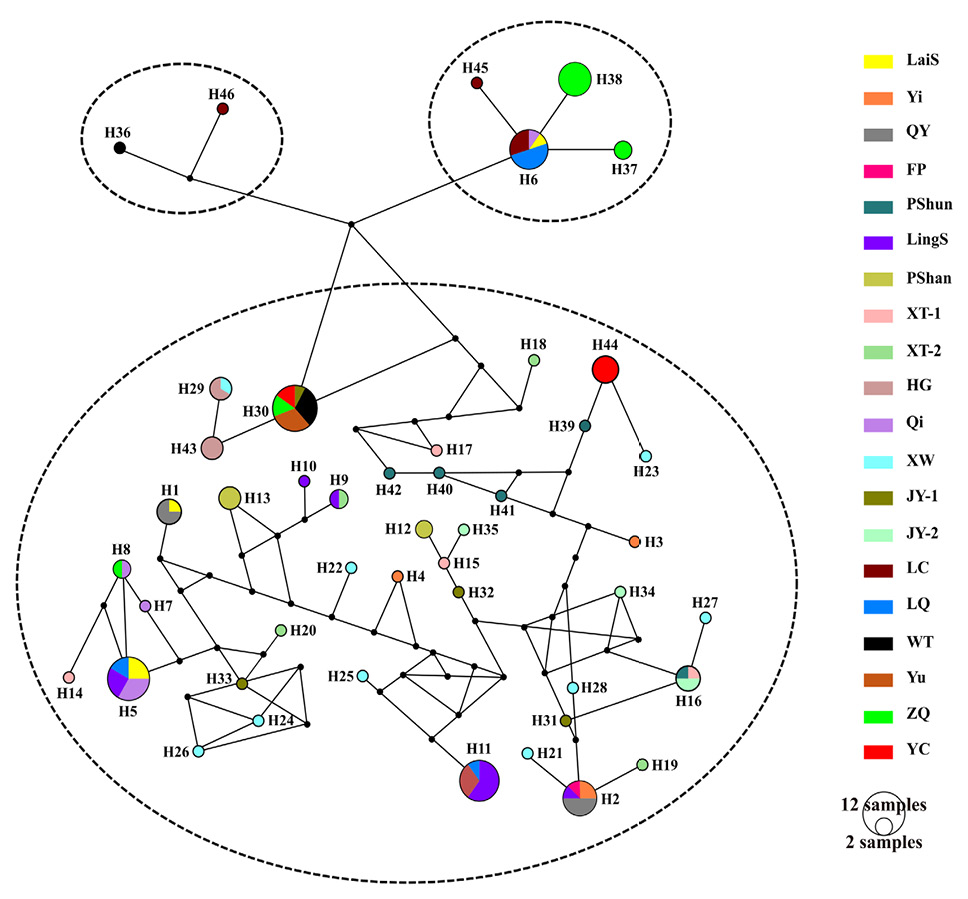
Fig. 3.
Median-joining haplotype network based on the concatenated mitochondrial Cytb and nuclear ITS-1 sequences. Each circle represents a specific haplotype, and its size proportional to its frequency. Different geographical populations are shown in different colors.