Fig. 3.
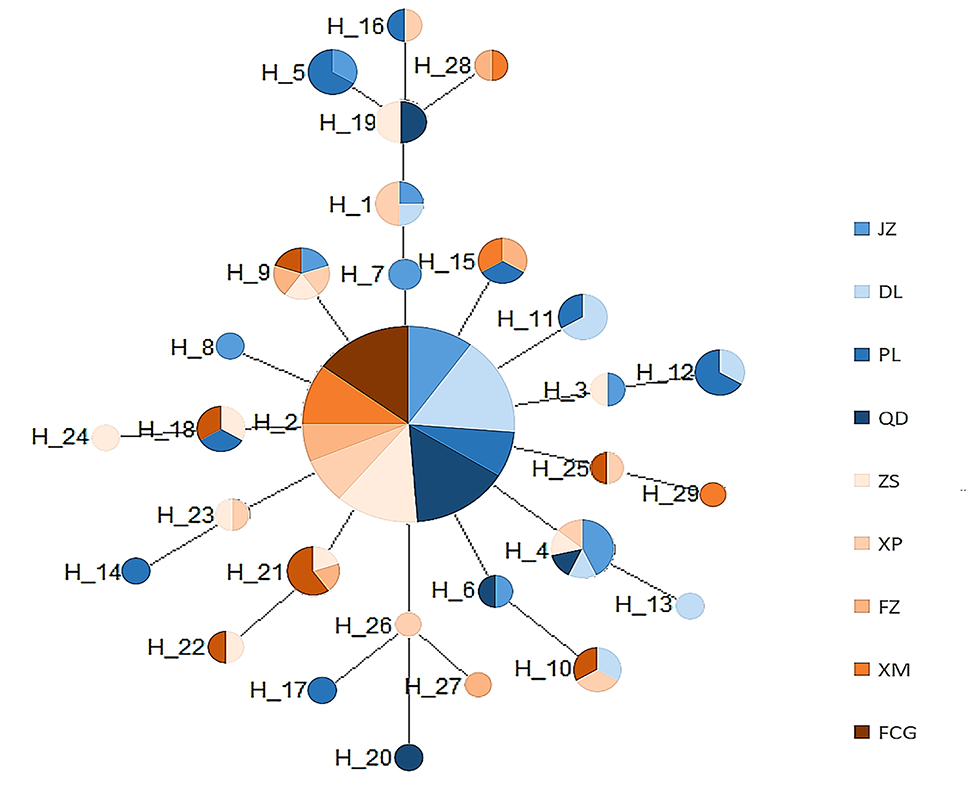
Networks of T. clavigera developed using COI data. Color representation is showing the population frequency. Numbers are representing the haplotype numbers.
Networks of T. clavigera developed using COI data. Color representation is showing the population frequency. Numbers are representing the haplotype numbers.