
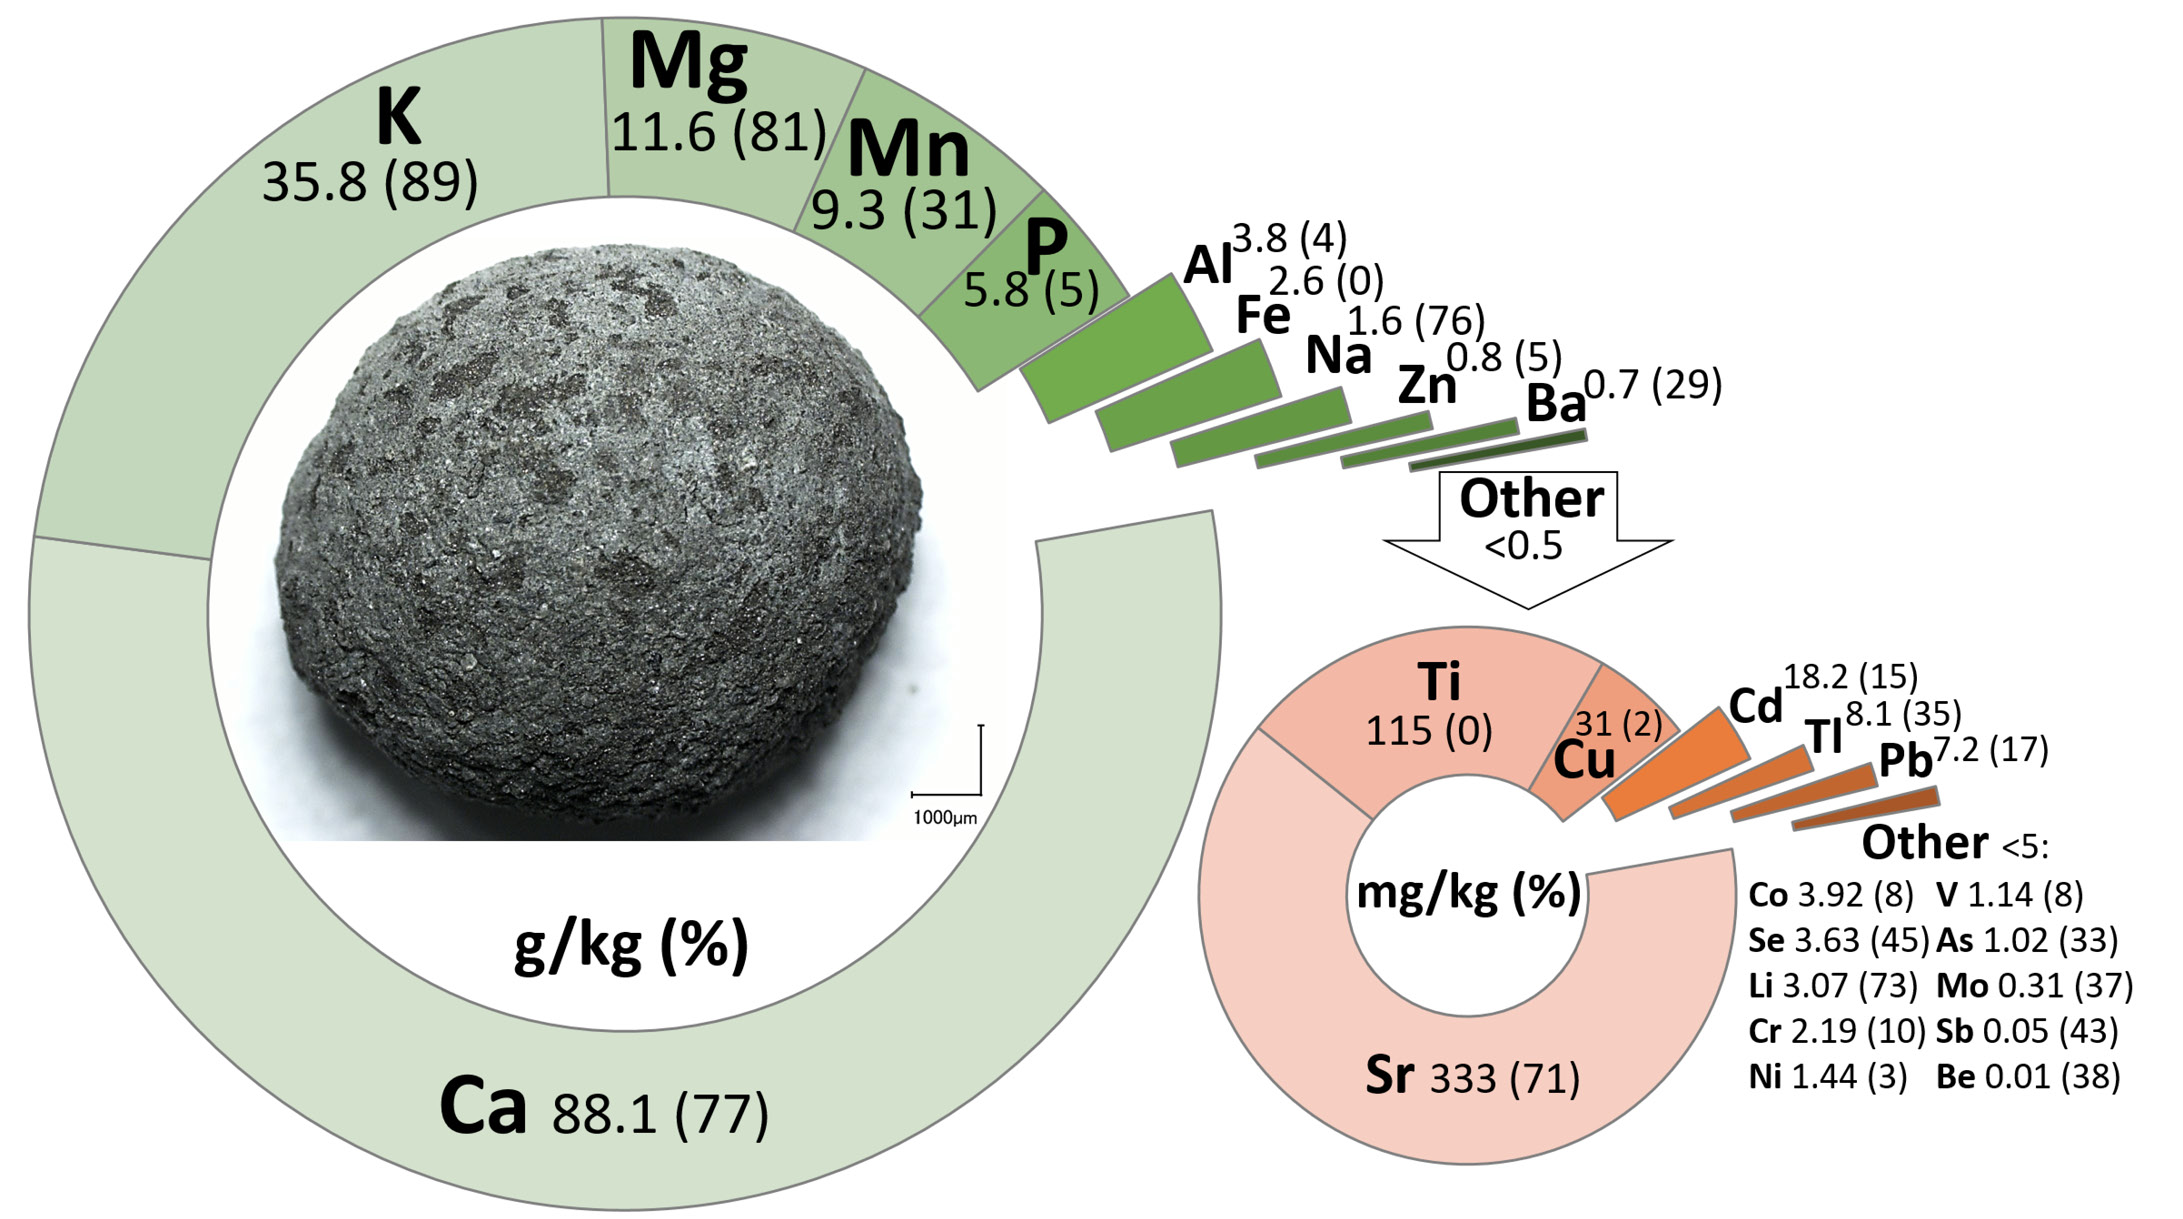
Figure 3:
Total content and bioavailability (in brackets) of elements (indicating maximum detected values as a worst-case), and visualization of a spherical ash-sapropel granule.
Total content and bioavailability (in brackets) of elements (indicating maximum detected values as a worst-case), and visualization of a spherical ash-sapropel granule.