View larger version:
Download Original File
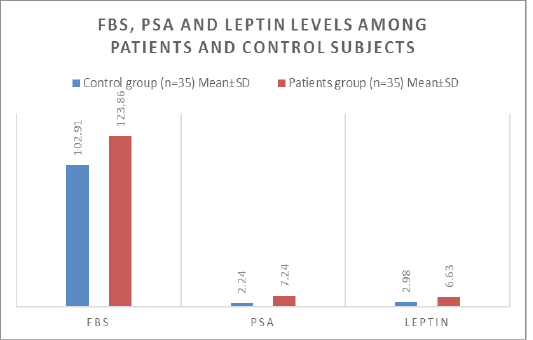
Figure 2
FBS, PSA and leptin levels among study group