Fig. 6.
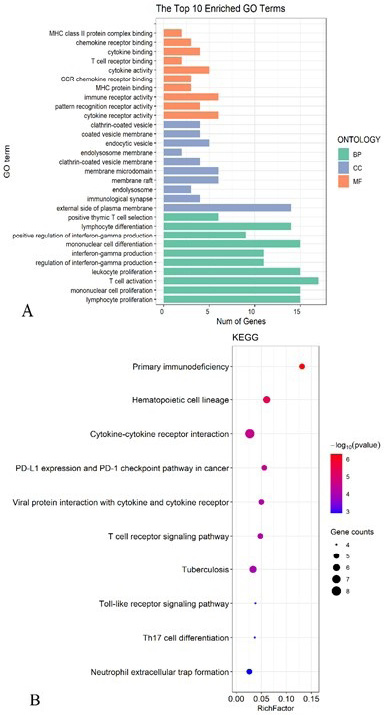
GO and KEGG enrichment analyses for the differentially expressed genes between the high-risk group and the low-risk group. (A) GO enrichment analysis. (B) KEGG enrichment analysis.
GO and KEGG enrichment analyses for the differentially expressed genes between the high-risk group and the low-risk group. (A) GO enrichment analysis. (B) KEGG enrichment analysis.