View larger version:
Download Original File
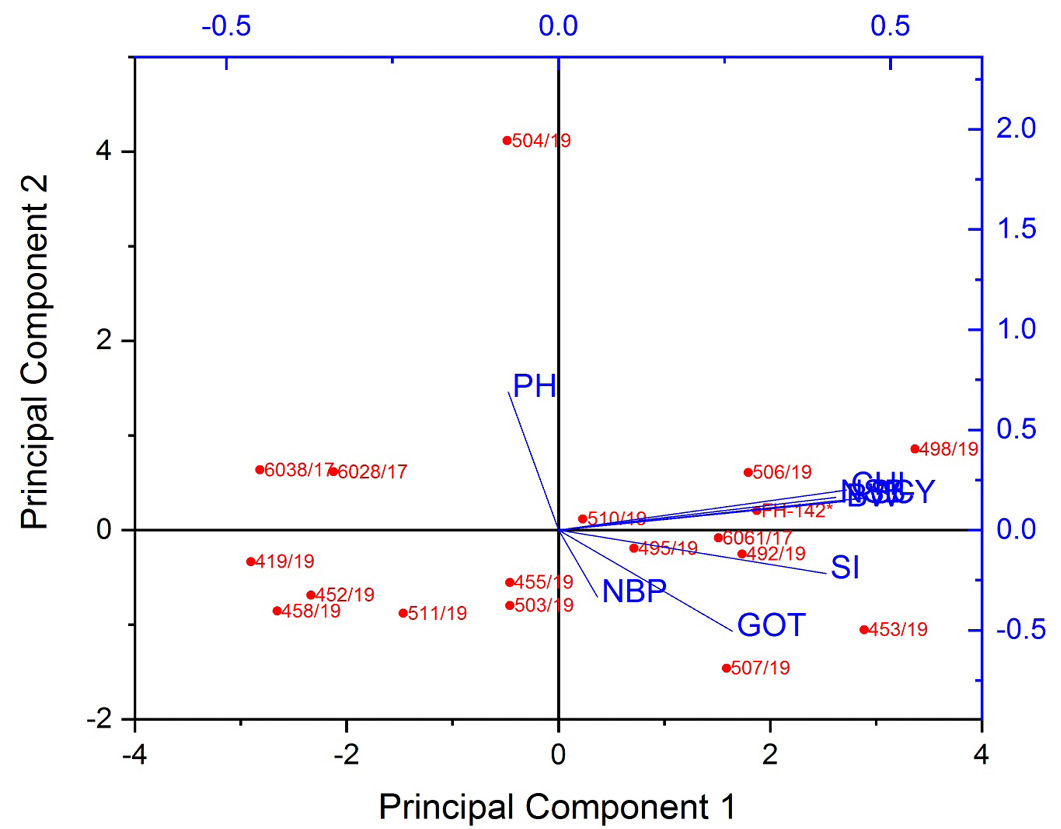
Figure 2:
Biplot between PC1 and PC2 showing extent of variation.