
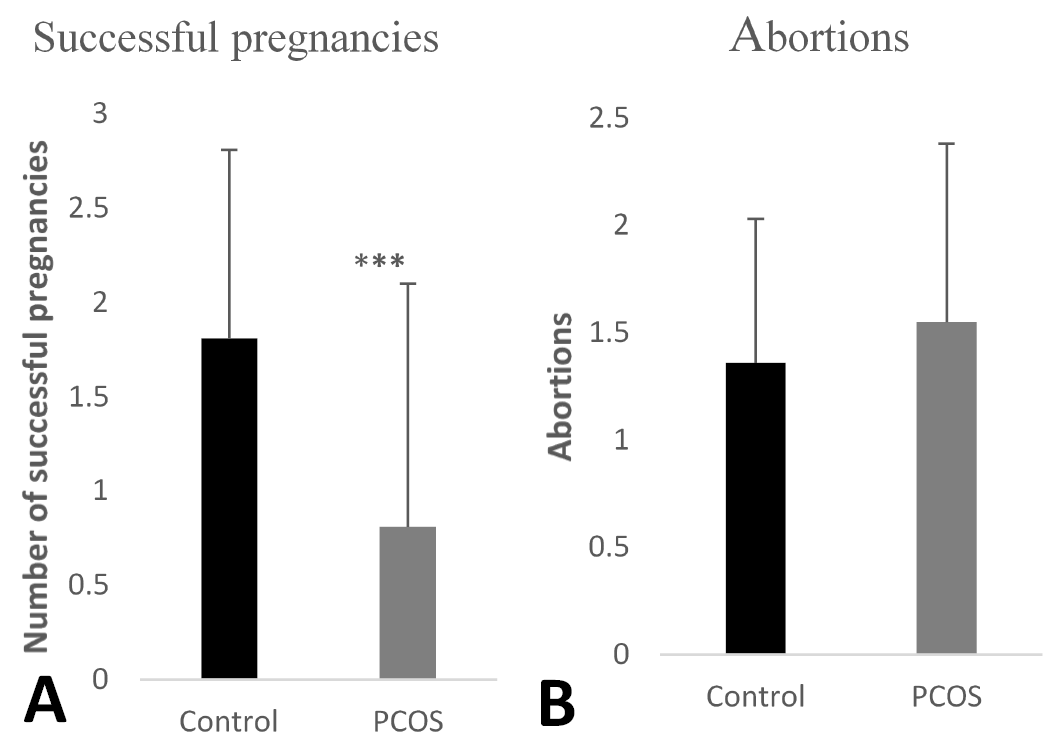
Figure 2:
(A) Comparison of mean number of successful pregnancies in control and PCOS participants. (B) Effect of PCOS on mean number of abortions as compared to healthy females. Values are expressed as Mean ± SD and comparison is made by two-tailed T-Test. ***P<0.001