
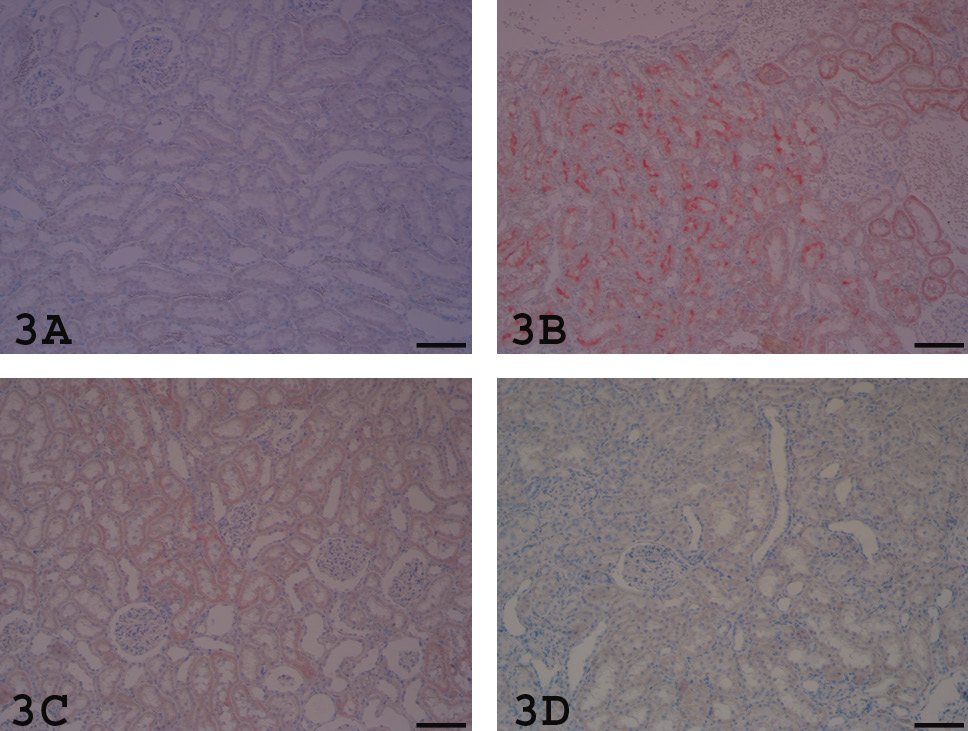
Fig. 3.
HIF-1α evaluation: kidneys stained with Streptavidin biotin peroxidase complex method with AEC chromogen and Mayer’s Hematoxylin counterstain, scale bar=150 µm. A, Control group revealed no positivity. B, CP group revealed specific positivity of tubuli. C, CP+EA50 group revealed mild positivity. D, CP+EA75 group revealed no positivity like control group.