View larger version:
Download Original File
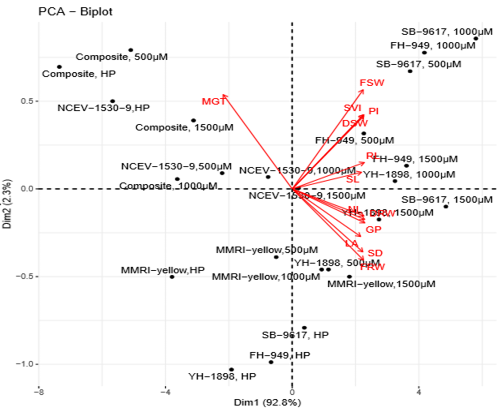
Figure 3:
Bi-plot showing the dispersion of different treatments combinations.