Figure 3:
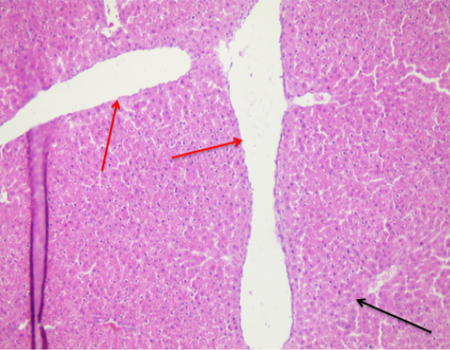
Photomicrograph of rats liver tissue section of AZA group, showed sever central vein dilatation (red arrow), significant hepatic degenerative changes (black arrow). (H and E, 20X).
Photomicrograph of rats liver tissue section of AZA group, showed sever central vein dilatation (red arrow), significant hepatic degenerative changes (black arrow). (H and E, 20X).