
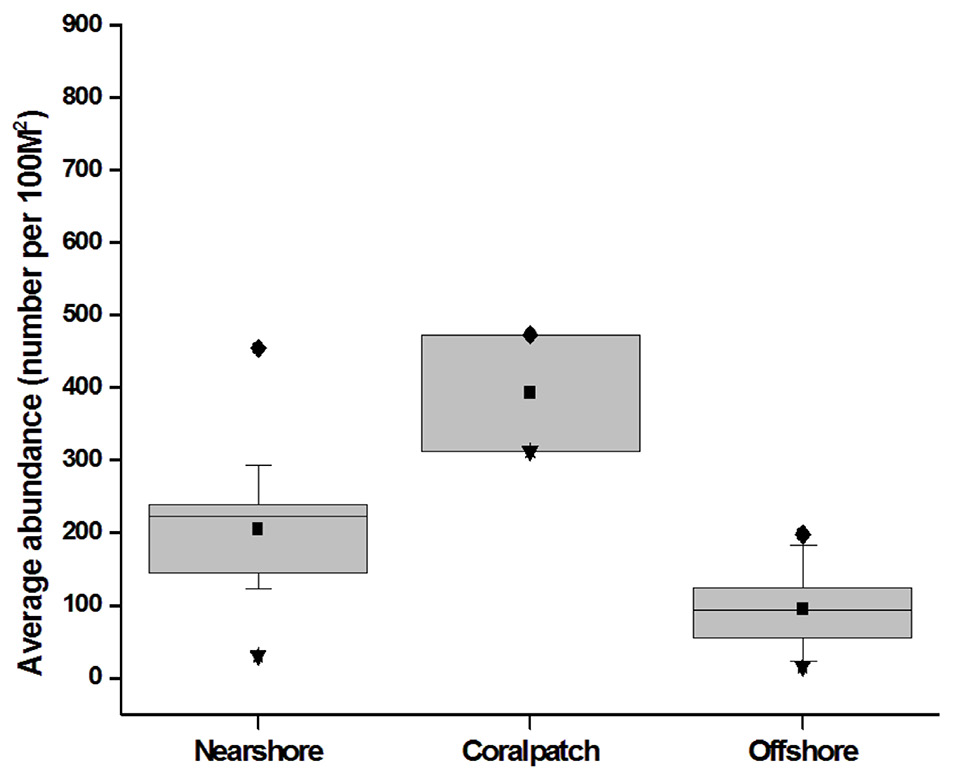
Fig. 3.
Average fish abundances obtained from the different zones during the study period (the whiskers represent the 25th and 75th percentile (lower and upper, respectively), the median is a solid line, the mean is indicated by a black square, and the error bars represents the variation within the region).