
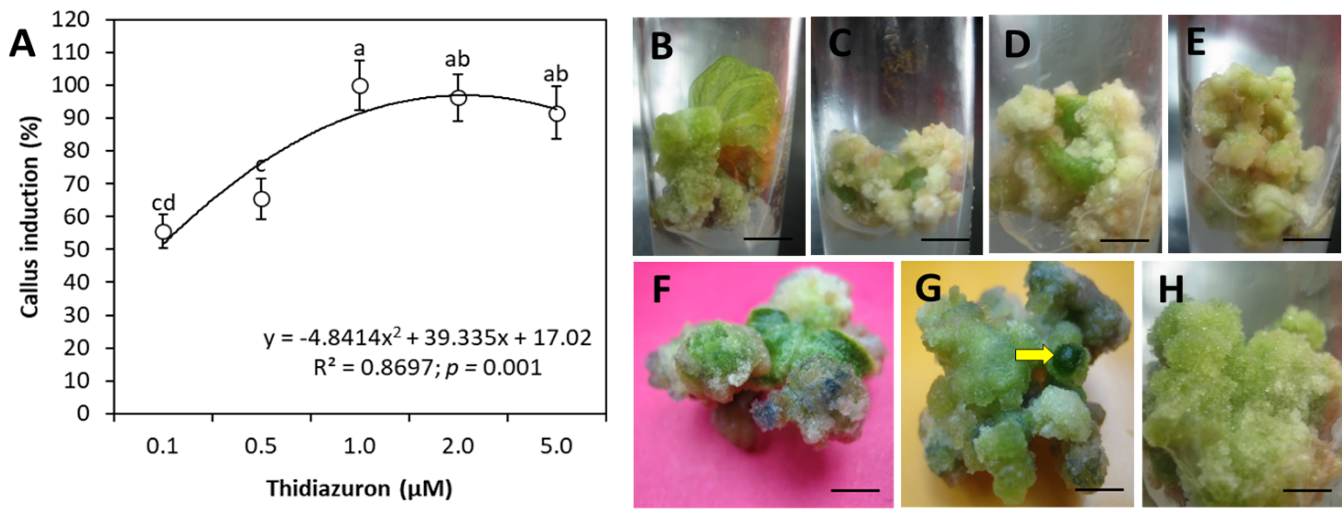
Figure 1:
Callus induction on MS medium from leaf explants of wild P. minima.
(A) Vertical bars above and below the circles are ± SE of the mean. Letters in the superscript in rows represent significant difference amongst the means of the two groups evaluated by the ANOVA followed by DMR post hoc test. Y in equation indicates the values of dependent variable and R2 is the Pearson coefficient of determination describing the covariance of the two variables (callus induction and TDZ concentration) divided by the product of their standard deviations. (B) Callus from cut margins of leaf explant on 0.1 µM TDZ Bar = 11 mm. (C, D) Off white loose callus at 0.5 µM TDZ after 10 days of culture Bar = 10 and 11 mm, respectively. (E) Subsequent development of callus mentioned in ‘C’ Bar = 10 mm. (F, G) Development of green nodules (yellow arrow) on green regenerating callus at 14 days of culture containing 1.0 µM TDZ Bar = 7 mm and 5 mm. (H) Granular greenish callus formation in 2.0 µM TDZ medium after 10 days Bar = 6 mm.