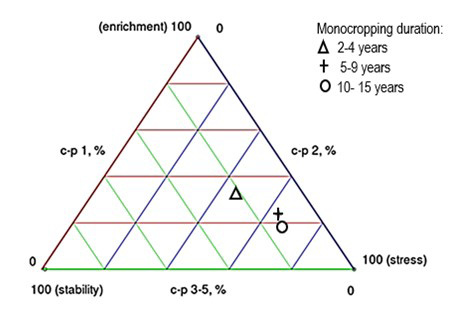
Figure 3:
c-p triangle depicting the succession of nematode c-p groups reflecting soil status of banana plantations under different cropping periods.
c-p triangle depicting the succession of nematode c-p groups reflecting soil status of banana plantations under different cropping periods.