
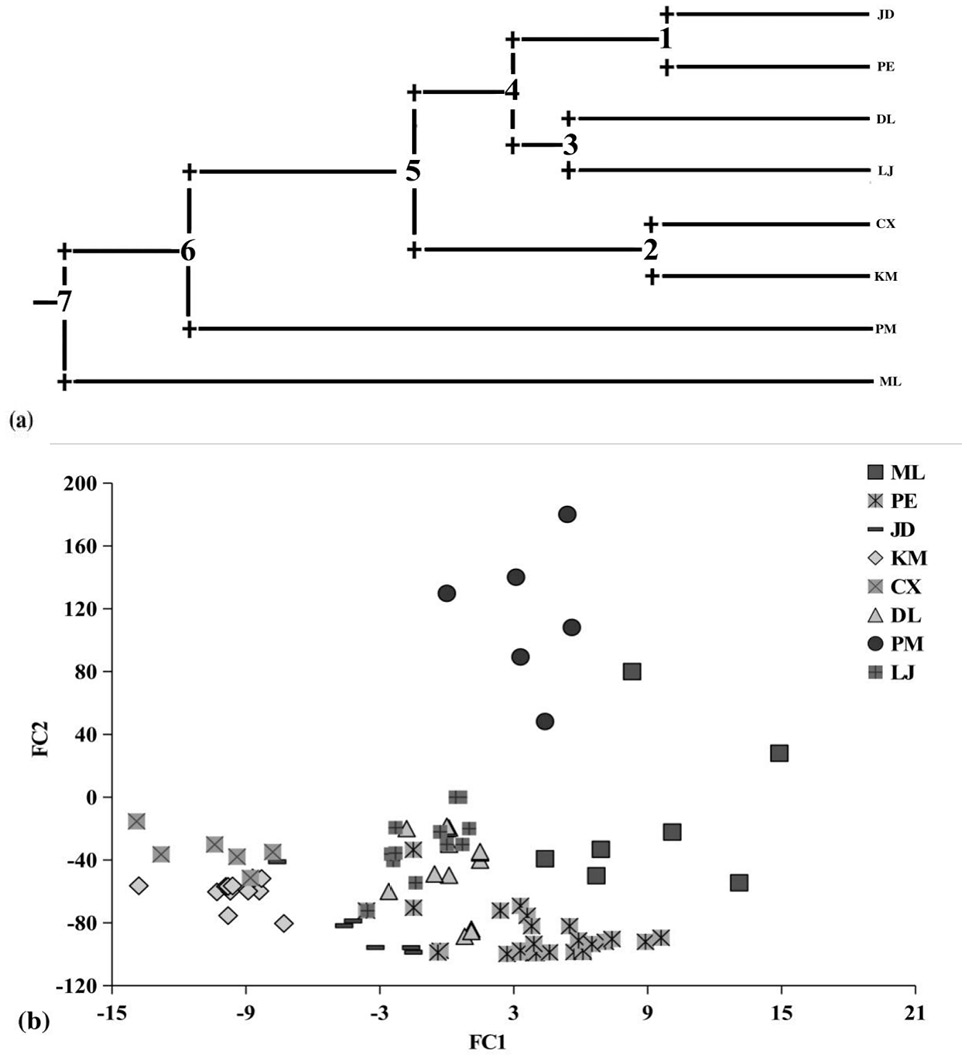
Fig. 4.
Population structure. (a) Clustering analysis of haplotype diversity of microsatellites of Tupaia belangeri chinensis by UPGMA. (b) Scatter plot of Factorial components 1 versus 2 (FC1 versus FC2) for the eight populations. Groups: ML, Mengla population; PE, Puer population; JD, Jingdong population; KM, Kunming population; CX, Chuxiong population; DL, Dali population; LJ, Lijiang population.