
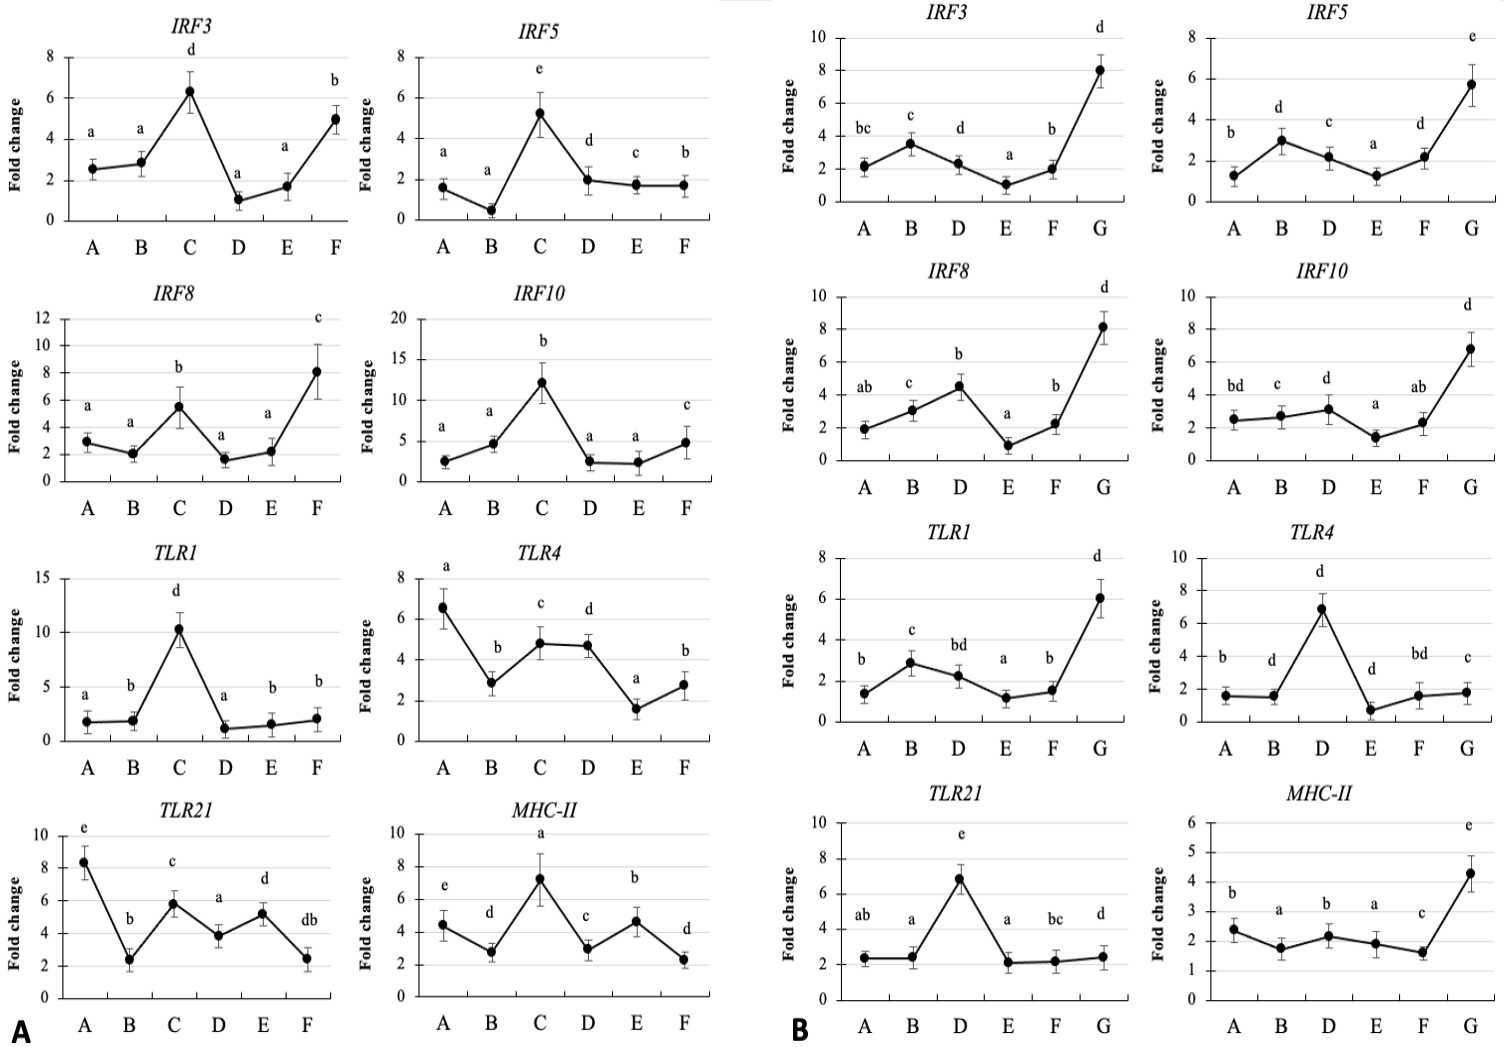
Fig. 3.
The mRNAs expression pattern of TLRs and immune-related genes TLR1, 4, 21, IRF3, 5, 8, 10, and and MHC-II in chicken erythrocyte, induced with thiram on day 6 (A) and day 10 (B). Basal diet containing groups (A, B and C) treated through 0, 20, 50 μg.kg-1 of recombinant glutathione S transferase A3 (rGSTA3) protein, and thiram-containing diet groups (D, E and F) treated through 0, 20, 50 μg.kg-1 of rGSTA3 protein, respectively. In each chick groups, different lowercase lettering (a–e) point out statistically significant differences (P < 0.05) and SEM (standard error of mean) represented by error bars.