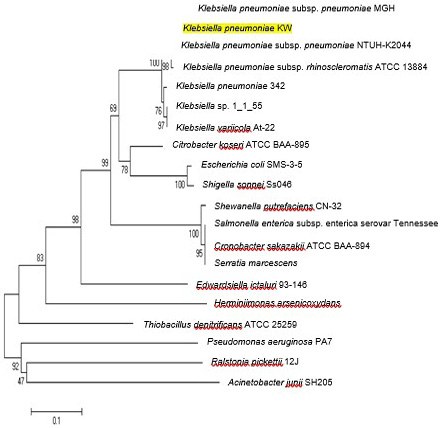
Fig. 2.
Neighbor joining trees showing relationship of CusS protein of K. pneumoniae KW among various bacterial strains. Bootstrap values expressed as a percentage of 1000 replications are given at branching points. In each tree, bar represents substitutions per residue position.
