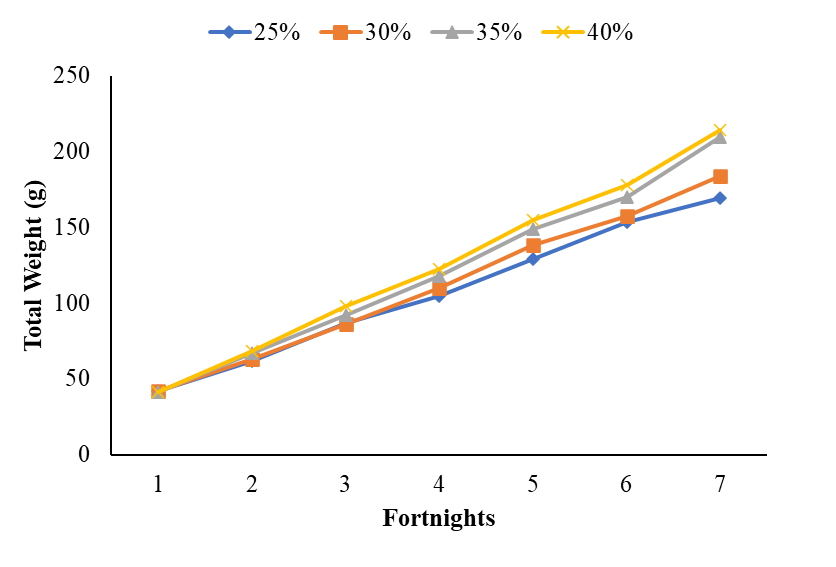
Figure 1:
Fortnightly growth trend of African catfish fed on different diets containing different levels of crude protein. Different letters show treatments differ significantly (P<0.05).
Fortnightly growth trend of African catfish fed on different diets containing different levels of crude protein. Different letters show treatments differ significantly (P<0.05).