
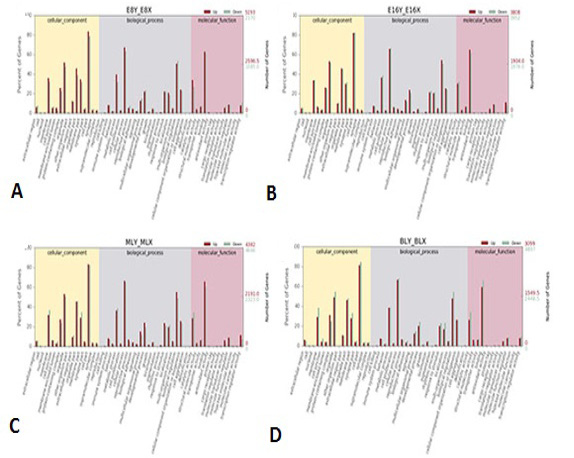
Fig. 5.
GO analysis of DEGs. GO enrichment analysis of DEGs in cattle embryos. (A) E8Y_vs_E8X; (B) E16Y_vs_E16X; (C) MLY_vs_MLX; (D) BLY_vs_BLX. The abscissa represents GO terms, the ordinate on the left represents the percentage of genes in all genes annotated with GO, right was the number of genes.