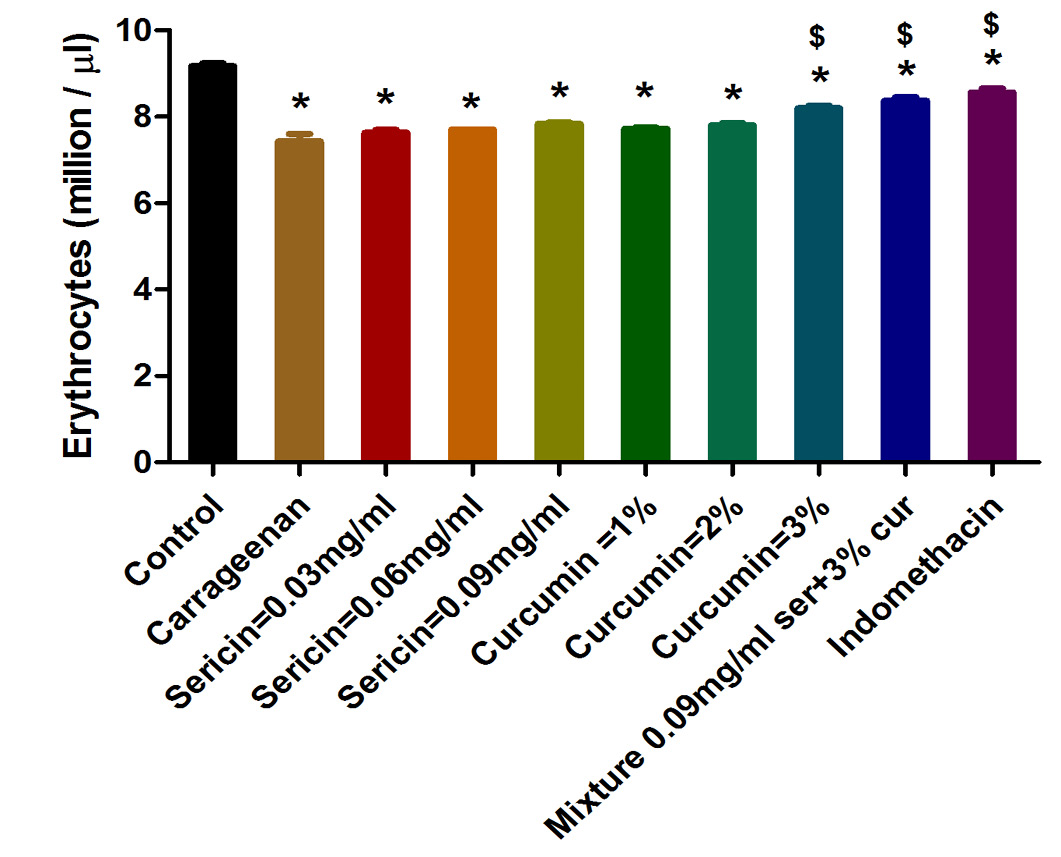
Figure 1:
The effect of different doses of sericin, curcumin and their mixture observed on the Erythrocytes count compared with the control and carrageenan (alone) induced group. Each value shows the mean ± SD (n=6). The data was analyzed by one way ANOVA followed by Bonferroni’s Multiple Comparison Test, * shows the significance (P < 0.05) in comparison to control and $ shows the significance (P< 0.05) in comparison to carrageenan.