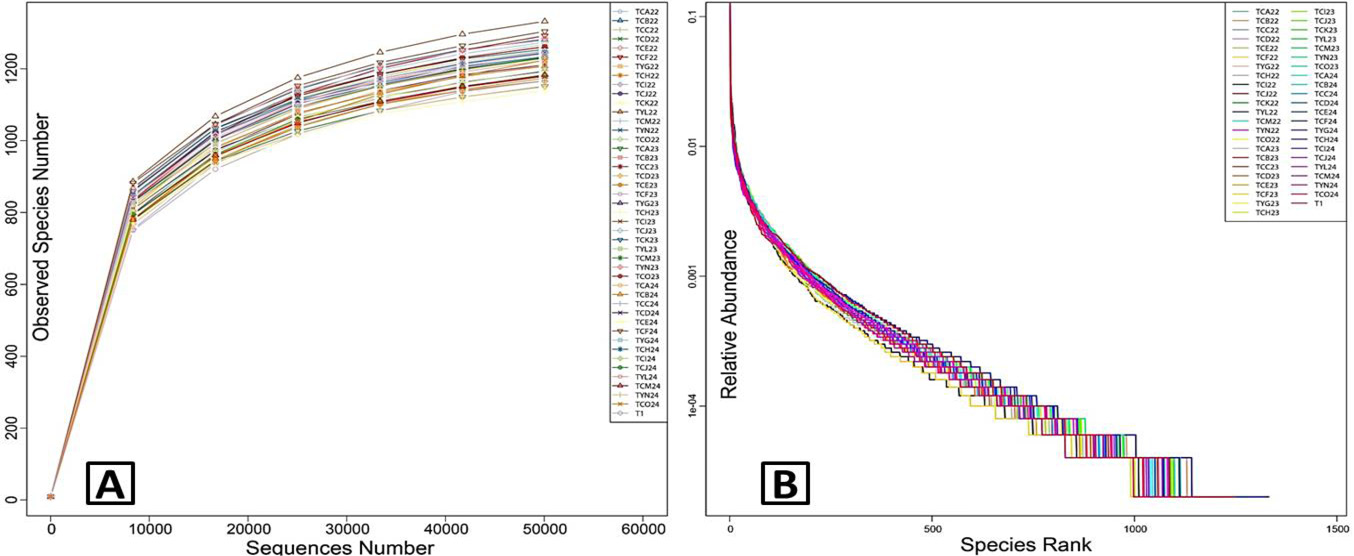
Fig. 1.
Species diversity curves. A, rarefaction curves; B, rank abundance curves. Plot A reflects indirectly the rationality of sequencing data size and richness of species in the faecal samples. When rarefaction curves tend to flatten, rational sequencing data is indicated. Plot B represents the richness and evenness of the species. The wider span of the curves illustrates the higher relative abundance of taxa in the x axis direction and the smoothness of the curves showed the evenness of bacterial species in the y axis direction. The figure legend at the top-right corner showed identification of each sample. TC, adult; TY, sub-adults, T1, infant.