
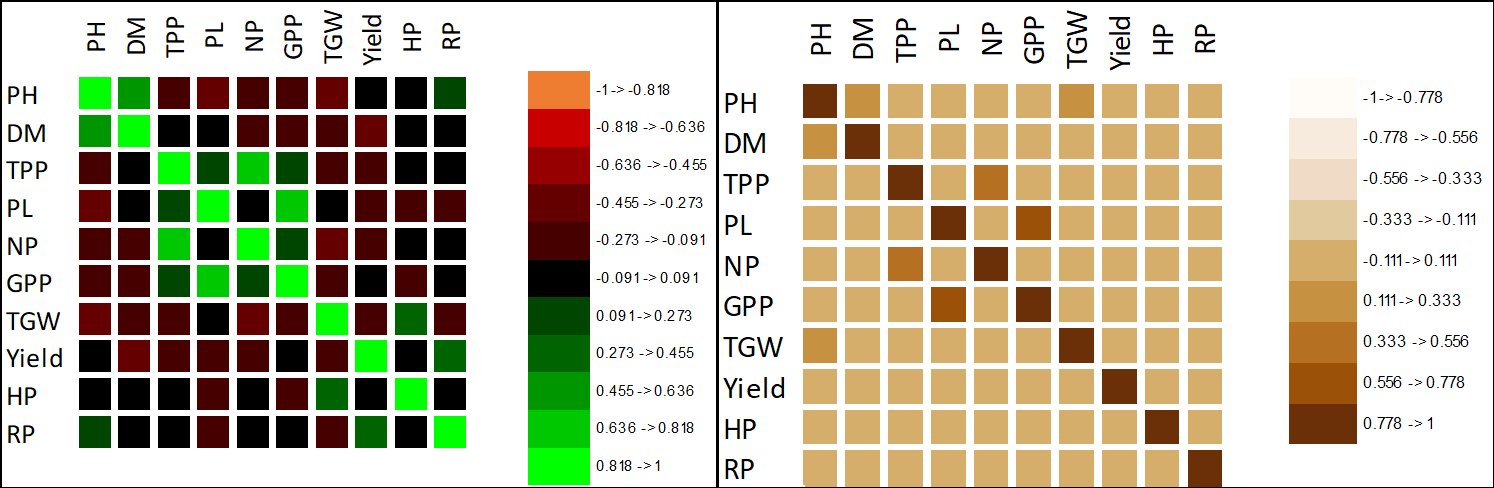
Figure 3 (a, b):
Diagrams are showing correlations and coefficients of determinations matrix within studied agronomic and physiological yield related traits. Level of significance was adjusted at 5%.
PH: Plant height; DM: Days to maturity; NTP: Number of tillers per plant; NP: Number of panicles per plant; NGP: Number of grains per panicle; PL: Panicle length; TGW: Thousand grain weight; GY: Grain yield; HP: Husk percentage; RP: Milling recovery percentage.