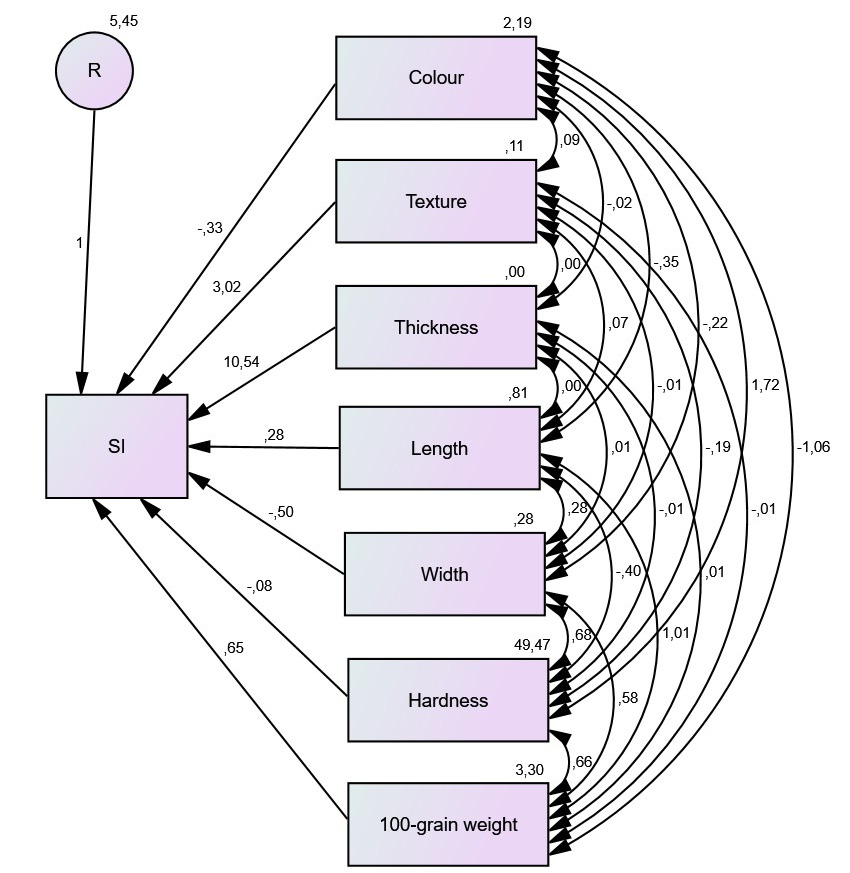
Figure 2:
Path diagram and coefficients showing causal relationship between Dobie susceptibility index (SI) and physical characteristics of soybean seeds from Benin. While the residual (R) shows the undetermined traits, the single and double arrowed lines illustrate a mutual association and direct influence, respectively.