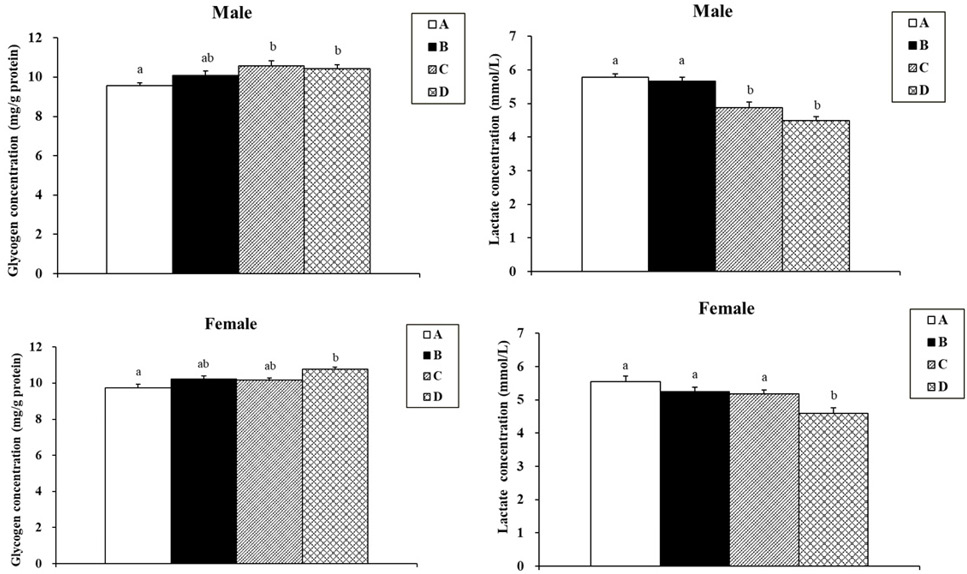
Fig. 6.
Effect of SPE on liver glycogen and serum lactate in SAMP8 mice. (A) Male (B) Female. Data were expressed as the mean ± SEM and analyzed by one-way ANOVA. Groups with different letters indicate significant differences among each group (p<0.05).