View larger version:
Download Original File
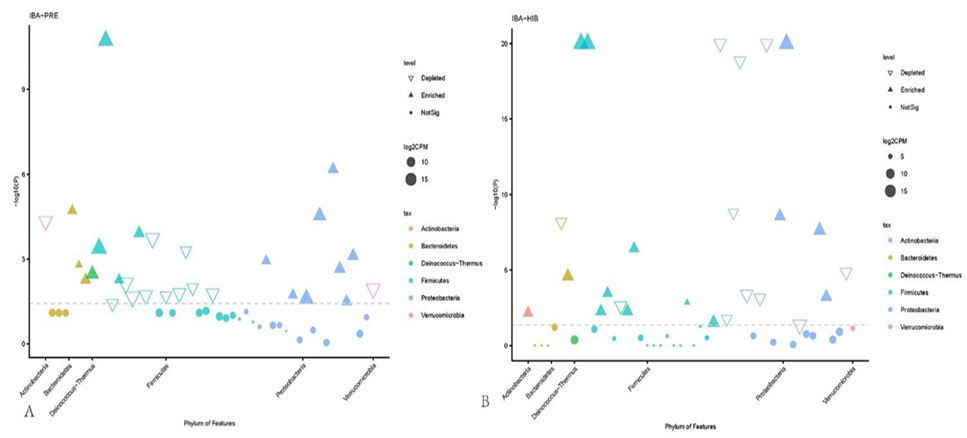
Fig. 11.
Manhattan chart of significant bacterial abundance at the phylum level in IBA, PRE, and HIB groups.