
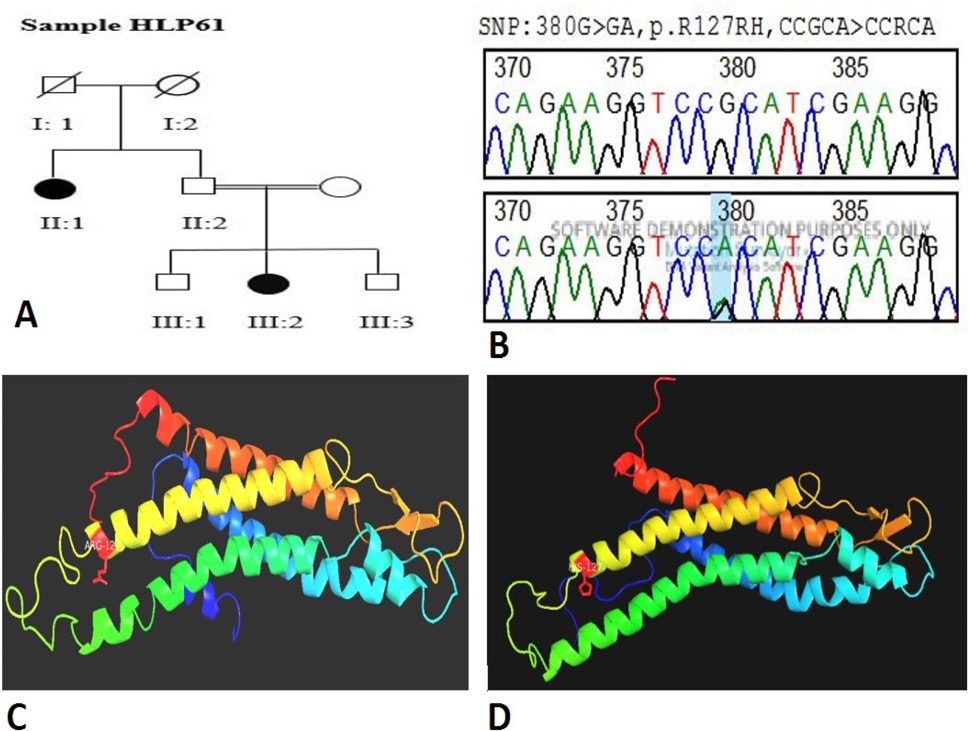
Fig. 1.
A, Pedigree of sample HLP61; B, chromatogram showing mutation 380G>A; C, Protein structure of the control sample; D, Protein structure of the mutated sample.
A, Pedigree of sample HLP61; B, chromatogram showing mutation 380G>A; C, Protein structure of the control sample; D, Protein structure of the mutated sample.