
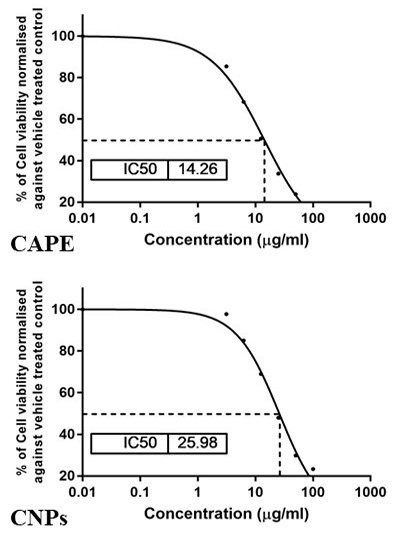
Fig. 2.
The cytotoxic potential of CAPE and CNPs on HepG2 cells. A representative graph displaying the IC50 value as revealed by the MTT assay. Cells were treated with CAPE or CNPs at serial concentrations from 3.125 to 100 μg/ml and were incubated for 24 h.