Figure 8:
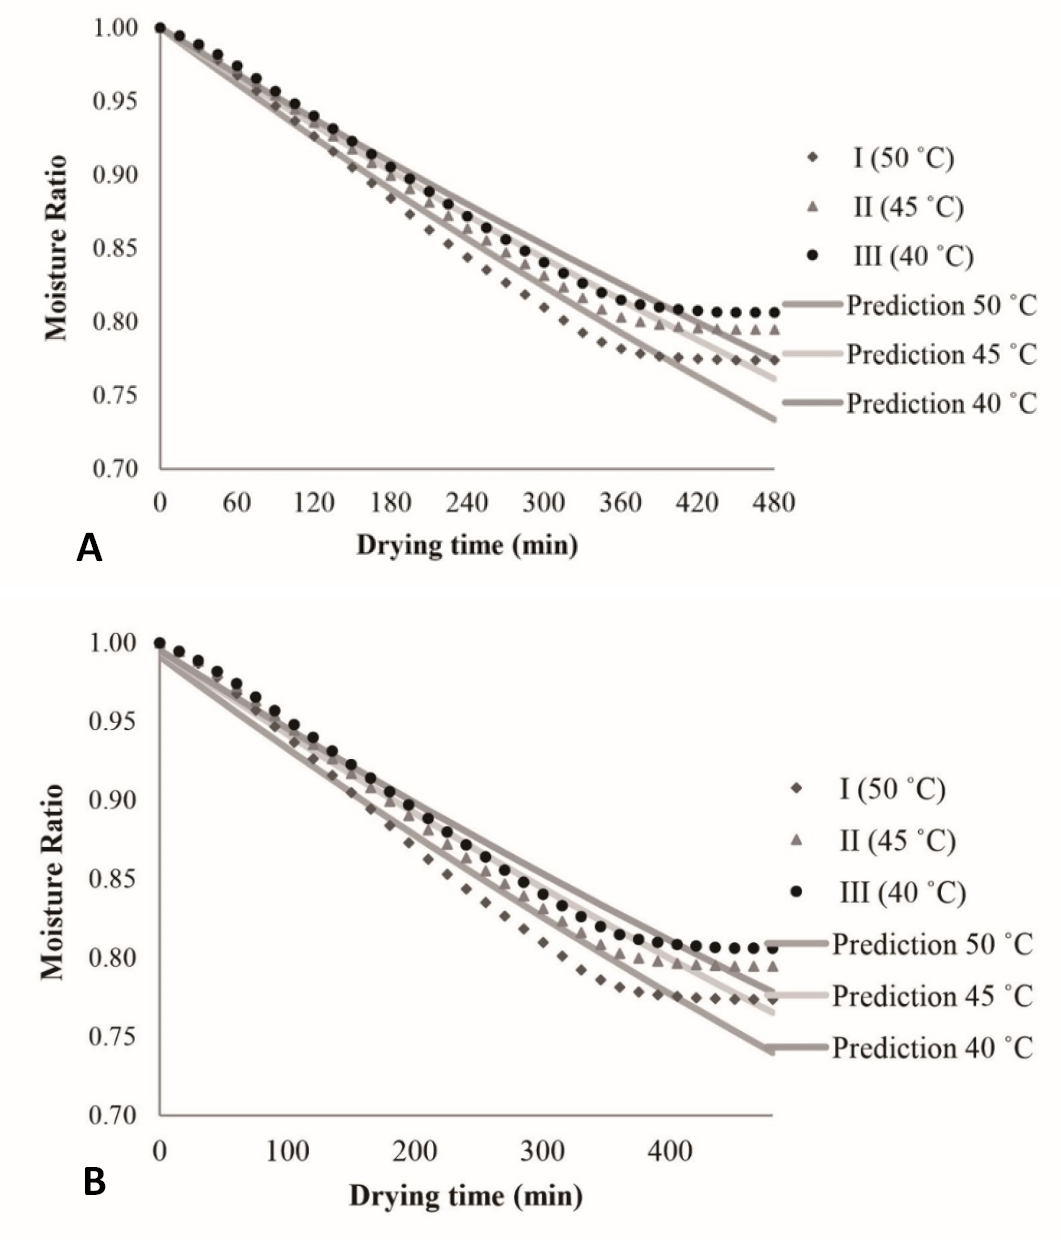
Graph of the difference between the observed value and the predicted value of variable I on various variables. (A) Lewis model, (B) Henderson and Pabis model.
Graph of the difference between the observed value and the predicted value of variable I on various variables. (A) Lewis model, (B) Henderson and Pabis model.