
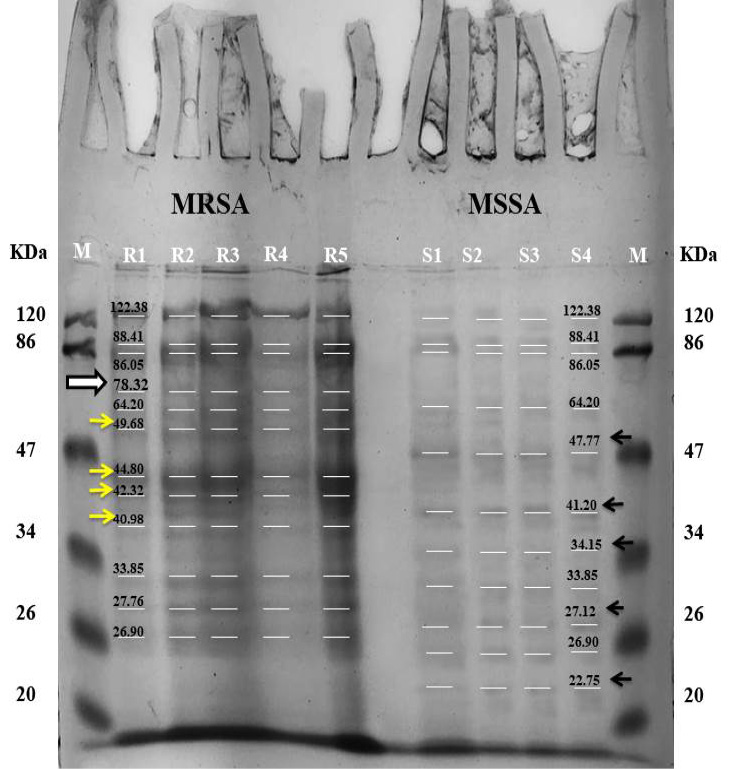
Fig. 3.
Manually labeled SDS-PAGE comparison results of MRSA and MSSA with a determined molecular weight of each band. (R1 to R5) shows MRSA isolates, while, (S1 to S4) shows the MSSA. The white arrow shows the presence of 78kDa band of PBP2a protein of MRSA and absent in MSSA. (Yellow arrows) Shows the difference in protein bands present in MRSA, (Black arrows) shows the difference in protein bands present in MSSA.