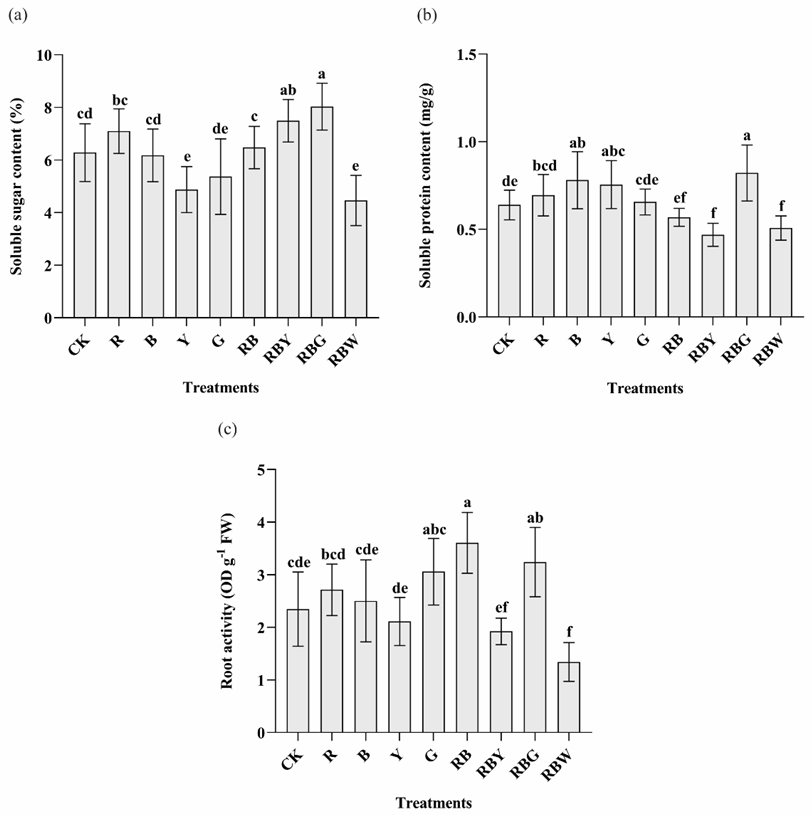
Figure 4:
Chlorophyll a, chlorophyll b, total chlorophyll, and Chl a/Chl b ratio in tissue culture seedlings of D. officinale under different light qualities. Different letters (a, b, c, d, e, f, g) indicate significant differences between treatments at P≤0.05 by using Duncan’s test. Vertical bars represent the standard deviation of the means (n = 10).
