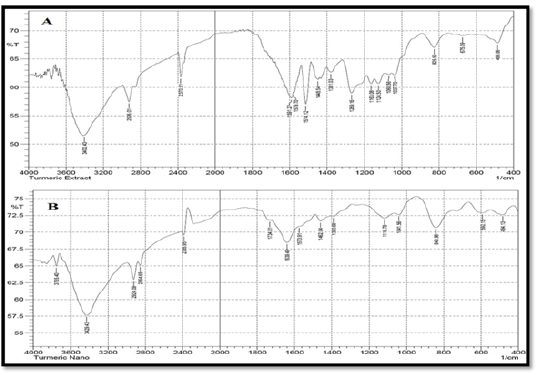
Figure 3A:
The FT-IR spectra of the alcoholic extract of Curcuma longa; B: the FT-IR spectrum of the functional groups of Curcuma longa extract coupled to SeNPs are provided.
The FT-IR spectra of the alcoholic extract of Curcuma longa; B: the FT-IR spectrum of the functional groups of Curcuma longa extract coupled to SeNPs are provided.