

The Nutritive Value of Guar Meal and its Effect on Growth Performance of Meat Ducks


The Nutritive Value of Guar Meal and its Effect on Growth Performance of Meat Ducks
Peng Peng1,3, Xiaopeng Tang2*, Dun Deng3, and Rejun Fang1*
1Hunan Co-Innovation Center of Animal Production Safety, College of Animal Science and Technology, Hunan Agricultural University, Changsha, China
2State Key Laboratory Cultivation for Karst Mountain Ecology Environment of Guizhou Province, School of Karst Science, Guizhou Normal University, Guiyang, China
ABSTRACT
The aim of this study was to study the effects of different levels of guar meal (GM) on growth performance of meat ducks, to explore the possibility of GM as an alternative protein resource in meat duck diets. Firstly, the chemical composition, dry matter (DM) digestibility, metabolic energy (ME) were determined. Secondly, a total of four hundred eighty 15-day-old Shuanggui-tou meat ducks were divided into 4 treatments, 1) Control group (0% GM in the diet), 2) 3% GM group (3% GM in the diet), 3) 6% GM group (6% GM in the diet), and 4) 9% GM group (9% GM in the diet). All groups had 8 replicates and 15 birds were included in each replicate. The experiment lasted for 28 days. The average daily gain (ADG), average daily feed intake (ADFI) and feed conversion ratio (FCR) were measured. Results showed that: (1) the DM, CP, EE, CF, Ash, Ca, Pi, GE content of GM is 89.96%, 47.80%, 4.92%, 6.43%, 4.49%, 0.3%, 0.63%, 4.66 Mcal/Kg, respectively, the composition of Met, Lys, Ile, Asp, Glu, Gly, His, Arg, Thr, Ala, Pro, Tyr, Val, Phe in GM is 0.499%, 2.023%, 1.485%, 2.795%, 4.834%, 11.543%, 2.626%, 1.315%, 6.128%, 1.491%, 1.905%, 1.750%, 1.498%, 1.680%, 2.184%, respectively. (2) The DMD and TDDM of GM is 47.13% and 58.31%, respectively. The AME, TME of GM is 2.71 Mcal/Kg and 3.03 Mcal/Kg, respectively. (3) Add GM to the duck diets significant affect the final weight (P<0.05), ADG (P<0.05), FCR (P<0.01), but had no effect on ADFI of ducks (P>0.05). Our results suggest that the GM would be a high quality protein resource in diets for meat ducks.
Article Information
Received 03 March 2019
Revised 13 June 2019
Accepted 02 September 2019
Available online 02 March 2020
Authors’ Contribution
PP designed and performed the experiments. PP and XT wrote the paper. DD and RF revised the paper.
Key words
Chemical composition, DM digestibility, Growth performance, Guar meal, Metabolism energy
DOI: https://dx.doi.org/10.17582/journal.pjz/20190303140327
* Corresponding author: tangxiaopeng110@126.com; fangrj63@126.com
0030-9923/2020/0003-1001 $ 9.00/0
Copyright 2020 Zoological Society of Pakistan
INTRODUCTION
Soybean meal (SBM) is widely used in poultry production. However, the SBM production in China is seriously deficient, and mainly relies on imports. It is of great significance for the development of Chinese poultry industry to seek soybean meal alternatives. The guar bean (Cyamopsis tetragonoloba) is an annual legume belonging to the Fabaceae family, which native to Africa, and now mainly produced in India and Pakistan (Pach and Nagel, 2018). Guar meal (GM) is a byproduct from guar gum industry, obtained after mechanical separation of endosperm from both germ and hull of guar seed (Janampet et al., 2016; Reddy et al., 2017). GM contains approximately 30-60 % protein on dry matter basis (Nidhina and Muthukumar, 2015; Janampet et al., 2016; Reddy et al., 2017; Pach and Nagel, 2018) and its amino acid (AA) composition quite similar to that of ground nut cake (Verma and McNab, 1984). It seems that GM is a desirable and viable protein source for animal feed formulators, especially when the rocketing prices of feed raw material.
In 1974, China had already introduced guar bean from Pakistan for trial promotion, and had been tried in Hunan, Guangdong, Sichuan, Hubei province and other places in China (Zhang, 1980). But, at present, due to the low production of guar bean, there are few researches and applications of GM in China. Due to its high protein content and relatively low price, GM presents itself as a viable alternative to SBM to be used as a protein supplement in poultry diets (Rao et al., 2015; Reddy et al., 2017). However, previous studies about GM used in poultry diets mainly focus on broilers and laying hens (Gutierrez et al., 2007; Ehsani and Torki, 2010; Rao et al., 2014; Tyagi et al., 2014; Salma et al., 2015; Rao et al., 2015; El-Masry et al., 2017), the researches about GM used in meat duck diets is rarely. So the aim of this study was to investigate the dry matter digestibility and metabolic energy of GM, and also to determine suitable level of GM in meat duck diets.
MATERIALS AND METHODS
Chemical composition of GM
GM used in this study was imported from Pakistan. Dry matter (DM), crude protein (CP), crude fat (EE), crude fiber (CF), Ash, Calcium (Ca) and Phosphorus (Pi) content of GM were determined according to the AOCS (2009) method. Amino acids (AA) profile of GM was analyzed using an automatic AA analyzer (L-8800; Hitachi, Tokyo, Japan). Gross Energy (GE) was measured by oxygen bomb calorimeter parr 1281 (Parr Instrument Company, IL, USA) according to ISO 9831 (1998) method.
DM digestibility and metabolic energy determination
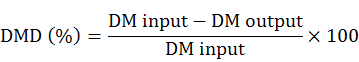
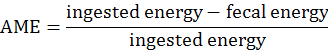
The experimental procedures were reviewed and approved by the Institutional Animal Care and Use Committee at the Hunan Agricultural University (Changsha, Hunan Province, China). DM digestibility and metabolic energy were measured by Emptying-force-feeding method (Sibbald, 1976). A total of 16 Shuanggui-tou meat ducks (Peking duck × hemp duck F1) with similar weight (2.20±0.15 kg) were divided into 2 treatments: (1) The starvation group and (2) GM group. Each treatment had 8 replicates. The starvation group was used to estimate metabolic and endogenous excretion (da Silva et al., 2012). The experiment procedure performed as previously described (Tang et al., 2018). Briefly, after a period of fast for 48 h, birds were fed 50 g GM. The birds in starvation group were kept under the same experimental conditions, at fasting, receiving only water for determination of the metabolic and endogenous losses (da Silva et al., 2012). The excreta were collected for 48 h. The excreta samples were dried at 65°C for 48 h, and milled for DM and energy analysis. DM was determined according to the AOCS (2009) method. Energy was measured by oxygen bomb calorimeter parr 1281 (Parr Instrument Company, IL, USA) according to ISO 9831 (1998). DM digestibility (DMD), true DM digestibility (TDMD), apparent metabolizable energy (AME), true metabolizable energy (TME) values were calculated according to the following formulae (Tang et al., 2018):


Effect of GM levels on the performance of meat ducks
A total of four hundred eighty 15-day-old Shuanggui-tou meat ducks were divided into 4 groups, 1) Control group with 0% GM in the diet, (2) 3% GM group, (3) 6% GM group and (4) 9% GM group (9% GM in the diet). Each treatment had 8 replicates, and each replicate had 15 ducks. The composition and nutrition level of the diets is shown in Table I. All diets were formulated to meet nutrient requirements of meat-type duck (NY/T 2122-2012). The ducks were housed in an environmentally controlled room with a 24-h constant light schedule and ad libitum access to water and feed. Ducks were weighed and feed consumption was recorded weekly. Average daily gain (ADG), average daily feed intake (ADFI) and feed conversion ratio (FCR) was calculated (FCR = ADFI / ADG). The experiment lasted for 28 days.
Table I. Diet composition and nutrient levels (on fed basis, %).
|
Ingredients |
Control |
3% GM |
6% GM |
9% GM |
|
Wheat |
77.00 |
76.50 |
75.60 |
75.40 |
|
6.00 |
3.00 |
0.00 |
0.00 |
|
|
Guar meal |
0.00 |
3.00 |
6.00 |
9.00 |
|
Oil bran |
5.00 |
5.00 |
5.00 |
8.00 |
|
Corn protein |
7.50 |
7.50 |
7.50 |
1.00 |
|
Zeolite powder |
1.80 |
2.28 |
3.14 |
3.89 |
|
Limestone |
0.60 |
0.57 |
0.53 |
0.50 |
|
CaHPO4 |
0.50 |
0.55 |
0.62 |
0.68 |
|
Bone meal |
0.50 |
0.50 |
0.50 |
0.50 |
|
Mildew preventive |
0.05 |
0.05 |
0.05 |
0.05 |
|
Lysine |
0.70 |
0.70 |
0.70 |
0.61 |
|
Methionine |
0.00 |
0.00 |
0.01 |
0.02 |
|
NaCl |
0.35 |
0.35 |
0.35 |
0.35 |
|
Premix1 |
1.00 |
1.00 |
1.00 |
1.00 |
|
Enzyme complex |
0.03 |
0.03 |
0.03 |
0.03 |
|
Nutrient levels2 |
||||
|
ME (Mcal/Kg) |
2.81 |
2.81 |
2.81 |
2.81 |
|
CP |
16.10 |
16.12 |
16.09 |
16.19 |
|
Lys |
0.79 |
0.79 |
0.79 |
0.79 |
|
Met |
0.31 |
0.31 |
0.31 |
0.31 |
|
Met+Cys |
0.58 |
0.56 |
0.55 |
0.54 |
|
Ca |
0.92 |
0.92 |
0.92 |
0.92 |
|
Available Pi |
0.26 |
0.26 |
0.26 |
0.26 |
1The premix provided following per kilogram of diet: Cu 20 mg, Fe 90 mg, Mn 70 mg, Zn 60 mg, I 0.38 mg, Se 0.20 mg, VA 3000 IU, VE 10 mg, VD3 500 IU, VK 0.5 mg, VB1 2 mg, VB2 5 mg, VB6 4 mg, nicotinic acid 20 mg, VB12 12 μg, D-pantothenic acid 15 mg, folic acid 550 μg. 2nutrient levels were calculated values.
Statistical analysis
Results of chemical composition, DM digestibility, true DM digestibility, AME, TME of GM were expressed as mean. Results of growth performance were analyzed by one-way ANOVA using the SPSS 21.0 programs (SPSS, Inc., Chicago, IL, USA). Differences among treatment mean were determined using Duncan’s multiple comparison test, P < 0.05 was considered significant, and P < 0.01 was considered extremely significant.
RESULTs AND DISCUSSION
The chemical composition of GM is shown in Table II. The nutritional profiles of GM vary widely according to different studies. Rao et al. (2014) reported that the CP content of GM was 48.6%, which is similar to the present study, but EE (6.39%), CF (11.97%), Ca (1.62%) and Pi (0.70%) was higher than the present study. The DM content in our study is similar to the results of Salma et al. (2015) (89.96% vs 89.49%), but CP (47.80% vs 50.09%), EE (4.92% vs 7.07%), CF (6.42% vs7.66%), Ash (4.49% vs7.88%) is lower and GE (4.66 Mcal/Kg vs 4.04 Mcal/Kg) is higher than that of Salma et al. (2015). Pach and Nagel (2018) reported that the DM, CP, EE, CF, Ash, Ca, Pi, GE content of GM is 93.8%, 59.5%, 9.06%, 5.33%, 6.08%, 0.2%, 0.74%, 21.1 Mcal/Kg, respectively. Compared to Pach and Nagel (2018), DM, CP, EE, Ash, Pi, GE content of GM in the present study is lower, and CF, Ca content is higher. The variations in proximate composition may be due to varieties, producing areas, and various processing techniques. It is important to analyze the proximate composition of GM before it is used in animal feed.
Table II. Chemical composition of guar meal (dry matter basis, %).
|
Item |
Content |
|
Dry matter, DM |
89.94 |
|
Crude protein, CP |
47.80 |
|
Ash |
4.49 |
|
Crude fiber, CF |
6.43 |
|
Crude fat, EE |
4.92 |
|
Calcium, Ca |
0.30 |
|
Phosphorus, Pi |
0.63 |
|
Gross energy, GE (Mcal/Kg) |
4.66 |
The composition of AA in GM is presented in Table III. GM is a good source of protein with an amino acid composition quite similar to that of ground nut cake (Verma and McNab, 1984). In this study, the Cys and Try were not detected. The composition of essential amino acids (EAA) Lys, Met, Thr, His, Leu, Ile, Phe, Val, Arg for poultry in SBM was 3.31%, 0.76%, 2.20%,1.48%, 4.25%, 2.55%, 2.77%, 2.63%, 3.92%, respectively (Pach and Nagel, 2018). It seemed that almost all EAA in GM is lower than SBM, except Arg, which is in accordance with Reddy et al. (2017) and Pach and Nagel (2018). However, Salma et al. (2015) reported that the Lys content in GM is higher than SBM, and Ile content in GM and SBM was equal. So, it is important to analyze the AA composition before using GM in poultry production, and additional AA may be added when necessary to make sure AA nutritional requirement for poultry.
Table III. The composition of amino acids in guar meal (%).
|
Item |
Content |
Item |
Content |
|
2.023 |
Threonine, Thr |
1.491 |
|
|
Methionine, Met |
0.499 |
Alanine, Ala |
1.905 |
|
Isoleucine, Ile |
1.485 |
Proline, Pro |
1.75 |
|
Leucine, Leu |
2.795 |
Cystine, Cys |
nd |
|
Aspartic acid, Asp |
4.834 |
Tyrosine, Tyr |
1.498 |
|
Glutamate, Glu |
11.543 |
Valine, Val |
1.68 |
|
Glycine, Gly |
2.626 |
Phenylalanine, Phe |
2.184 |
|
Histidine, His |
1.315 |
Tryptophane, Try |
nd |
|
Arginine, Arg |
6.128 |
Total |
43.76 |
nd: not detected.
Table IV. Effects of guar meal levels on the performance of meat ducks (g, g/d).
|
Item |
Control |
3% GM |
6% GM |
9% GM |
P-value |
|
Initial weight |
493.4±3.9 |
493.6±3.7 |
493.9±3.1 |
494.1±2.7 |
0.984 |
|
Final weight |
1644.5±21.8a |
1609.3±28.1b |
1662.2±44.4a |
1663.2±33.3a |
0.014 |
|
ADFI |
131.4±3.4 |
129.8±4.0 |
132.0±3.9 |
132.7±4.4 |
0.513 |
|
ADG |
41.1±0.8ab |
39.9±1.0b |
41.7±1.6a |
41.8±1.2a |
0.017 |
|
FCR |
3.20±0.05B |
3.28±0.05A |
3.16±0.07B |
3.18±0.05AB |
0.003 |
ADFI, average daily feed intake; ADG, Average daily gain; FCR, feed conversion ratio; a,b,c, Means within rows with different letters differ significantly (P < 0.05); A,B means within rows with different letters differ extremely significantly (P < 0.01).
DM digestibility and metabolic energy of GM
The DMD, TDMD, AME, TME of GM are shown in Figure 1. In this study, the DMD and TDMD of GM is 47.13% and 58.31%, respectively. The AME, TME of GM is 2.71 Mcal/Kg and 3.03 Mcal/Kg, respectively. Nagpal et al. (1971) determined the ME value of GM for chicken as 2.01 Mcal/Kg, and Nadeem et al. (2005) reported that the ME value of GM for chicken was 2.311 Mcal/Kg. The above ME values are lower than the present study. Basically, the nutrition digestibility of chicken and duck is not the same. In general the digestibility of duck is higher than that of chicken (Tian et al., 2017). This is related to the digestive physiological characteristics of ducks. The pH value in the digestive tract of ducks is appropriate, which is advantageous to the digestive enzyme. At the same time, the capacity and weight of the digestive organs of duck is larger than that of chicken, which is conducive to the rapid digestion and absorption of the digested components (Fan et al., 2006).
Growth performance
Table IV shows the growth performance of ducks The duck diets supplemented with GM have significant affect on the final weight (P<0.05), ADG (P<0.05), FCR (P<0.01), but had no effect on ADFI of ducks. Compared to control group (0% GM), the final weight of 3% GM group decreased significantly (P<0.05) whereas the FCR of 3% GM group increased significantly (P<0.01). The growth performance of 6% and 9% GM group were similar to the control group. There have been many reports about the application of GM in broilers and laying hens, which reported that a certain level of GM would not affect the growth performance of broilers chickens and egg production performance of laying hens (Ehsani and Torki, 2010; Gheisari et al., 2011; Rao et al., 2014; Tyagi et al., 2014; Salma et al., 2015; Rao et al., 2015; El-Masry et al., 2017). There are a few studies on GM administered to duck diets. Because the digestive characteristics of duck are different from chicken, the results obtained from chicken experiment cannot be fully used for duck. For example, Hassan et al. (2013) and Salma et al. (2015) reported that when fed ≥5% GM in broilers the FI was reduced, which is not consistent with the result of this study. According to the present study, GM used upto 9% in ducks did not affect the ADG, ADFI and FCR. It would be a high quality protein source in duck feed.
CONCLUSION
In conclusion, GM is a good source of protein with the CP content as high as 47.80%. The AA in GM is reasonable, especially rich in Arg with 6.128% content. DMD and TDDM of GM is 47.13% and 58.31%, respectively. The AME, TME of GM is 2.71 Mcal/Kg and 3.03 Mcal/Kg, respectively. GM used up to 9% in ducks without affecting the ADG, ADFI and FCR. Our results suggest that the GM would be a high quality protein source in diets for meat ducks.
ACKNOWLEDGMENTS
The research was supported by National Key Research and Development Program ( 2018YFD0501403-2.3 and 2018YFD0500605); the grants from the Key Project of Science and Technology Program of Guizhou Province: Model and Technology demonstration for the karst desertification control (5411 2017 Qiankehe Pingtai Rencai); and the Doctoral Launched Scientific Research Program of Guizhou normal university (GZNUD(2018)26).
Statement of conflict of interest
The authors have declared no conflict of interest.
REFERENCE
AOCS., 2009. Official methods and recommended practices of the AOCS, 6th edition. American Oil Chemists Society, Chicago, Illinois, USA.
da Silva, E.A., Albino, L.F.T., Rostagno, H.S., Vieira, R.A., Junior, V.R. and Pereira, J.P.L., 2012. Determination of true digestible amino acids of feedstuffs utilizing cecectomized roosters. Rev. Bras. Zootecn., 41: 2070-2078. https://doi.org/10.1590/S1516-35982012000900015
Ehsani, M. and Torki, M., 2010. Effects of dietary inclusion of guar meal supplemented by β-mannanase on performance of laying hens, egg quality characteristics and diacritical counts of white blood cells. Am. J. Anim. Vet. Sci., 5: 237-243. https://doi.org/10.3844/ajavsp.2010.237.243
El-Masry, K.N., Ragaa, N.M., Tony, A.M. and El-Banna R.A., 2017. Effect of dietary inclusion of guar meal with or without β-mannanase supplementation on broiler performance and immunity. Pak. J. Nutri., 16: 341-350. https://doi.org/10.3923/pjn.2017.341.350
Fan, H., Hou, S., Huang, W., Wang Y., Wang, W. and Xiu, M. 2006. Comparative study of the pH in digestive tract and digestive enzyme between Cock and Drake. Acta Vet. Zootech. Sin., 37:1009-1015.
Gheisari, A.A., Zavareh, M.S., Toghyani M, Bahadoran, R. and Toghyani, M., 2011. Application of incremental program, an effective way to optimize dietary inclusion rate of guar meal in broiler chicks. Livest. Sci., 140: 117-123. https://doi.org/10.1016/j.livsci.2011.02.018
Gutierrez, O., Zhang, C., Cartwright, A.L., Carey, J.B. and Bailey, C.A., 2007. Use of guar by-products in high-production laying hen diets. Poult. Sci., 86: 1115-1120. https://doi.org/10.1093/ps/86.6.1115
Hassan, S.M., Al-Yousef, Y.M. and Bailey, C.A., 2013. Effects of guar bean, guar meal and guar gum on productive performance of broiler chicks. Asian J. Poult. Sci., 7: 34-40. https://doi.org/10.3923/ajpsaj.2013.34.40
ISO 9831, 1998. Animal feeding stuffs, animal products, and faeces or Urine-Determination of gross calorific value - Bomb calorimeter method.
Janampet, R.S., Malavath, K.K., Neeradi, R., Chedurupalli, S. and Thirunahari, R., 2016. Effect of feeding guar meal on nutrient utilization and growth performance in mahbubnagar local kids. Vet. World, 9: 1043-1046. https://doi.org/10.14202/vetworld.2016.1043-1046
Tian, L., Li, X., Zhou, D., Li, M., Li, M., Zhai, S., Zhang, X., Yang, L., Wang, W. and Zhu, Y., 2017. Comparison on energy availability in Distiller’s grains and fermented distiller’s grains of cocks, ducks and geese. Chinese J. Anim. Nutri., 29: 2423-2430.
Mohamed, K., Leclercq, B., Anwar, A., El-Alaily, H. and Soliman, H., 1984. A comparative study of metabolisable energy in ducklings and domestic chicks. Anim. Feed Sci. Tech., 11: 199-209. https://doi.org/10.1016/0377-8401(84)90063-4
Nadeem, M.A., Gilani, A.H., Khan, A.G. and Mahr-UN-Nisa., 2005b. True metabolisable energy values of poultry feedstuffs in Pakistan. Int. J. Agric. Biol., 7: 990-994.
Nagpal, M.L., Agrawal, O.P. and Bhatia, I.S., 1971. Chemical and biological examination of guar Meal (Cyamopsis tetragonoloba L.). Indian J. Anim. Sci., 41: 283-293.
Nidhina, N. and Muthukumar, S.P. 2015. Antinutritional factors and functionality of protein-rich fractions of industrial guar meal as affected by heat processing. Fd. Chem., 173: 920-926. https://doi.org/10.1016/j.foodchem.2014.10.071
Pach, F. and Nagel, F., 2018. Replacing the substitute-guar meal as an alternative for non-genetically modified soybean meal in the nutrition of rainbow trout (oncorhynchus mykiss, walbaum, 1792). Aquacult. Nutr., 24: 666-672. https://doi.org/10.1111/anu.12557
Rao, S.V.R., Prakash, B., Raju, M.V.L.N., Panda, A.K. and Murthy, O.K., 2014. Effect of supplementing non-starch polysaccharide hydrolyzing enzymes in guar meal based diets on performance, carcass variables and bone mineralization in vanaraja chicken. Anim. Feed Sci. Tech., 188: 85-91. https://doi.org/10.1016/j.anifeedsci.2013.10.021
Rao, S.V.R., Raju, M.V.L.N., Prakash, B., Reddy, E.P.K. and Panda, A.K., 2015. Effect of dietary inclusion of toasted guar (Cyamopsis tetragonoloba) meal as a source of protein on performance of white leghorn layers. Br. Poult. Sci., 56: 733–739. https://doi.org/10.1080/00071668.2015.1113498
Reddy, E.T., Reddy, V.R., Preetham, V.C., Rao, S.V.R. and Rao, D.S., 2017. Effect of dietary inclusion of graded levels of toasted guar meal on performance, nutrient digestibility, carcass traits, and serum parameters in commercial broiler chickens. Trop. Anim. Hlth. Prod., 49: 1409–1414. https://doi.org/10.1007/s11250-017-1341-5
Salma, H.A.H., Basyony, M.M. and Hassan. A.A., 2015. Effect of partial replacement of Soybean meal with different levels of guar korma meal on growth performance, carcass traits and blood metabolites of broiler chickens. Asian J. Poult. Sci., 9: 112-122. https://doi.org/10.3923/ajpsaj.2015.112.122
Sibbald, I.R., 1976. A bioassay for true metabolizable energy in feeding stuffs. Poult. Sci., 55: 303-308. https://doi.org/10.3382/ps.0550303
Tang, X., Rong, X., Chen, S., Yang, S., Hu, L., Fang, R. and Li, A., 2018. Effects of fermented cottonseed meal and enzymatic hydrolyzed cottonseed meal on amino acid digestibility and metabolic energy in white leghorn rooster. Pakistan J. Zool., 50: 957-962. https://doi.org/10.17582/journal.pjz/2018.50.3.957.962
Tyagi, P.K., Munj, C.P., Tyagi P.K., Mandal, A.B., Dinani, O.P. and Shrivastav, A.K., 2014. Effect of feeding fungal fermented and toasted guar meal with or without enzyme supplementation on production performance in quail layers. Indian J. Poult. Sci., 49: 11-16.
Verma, S.V.S. and McNab, J.M., 1984. Chemical, biochemical and microbiological examination of guar meal. Indian J. Poult. Sci., 19: 165–170.
Zhang, Y. Study on cultivated guar meal. 1980. Acta Bot. Yunnan, 2: 42-51.
To share on other social networks, click on any share button. What are these?


