

Population Dynamics of Whitefly and Thrips under Different Row Spacing and Plant Density Conditions in a Cotton Field of Punjab, Pakistan


Description of Factors Affecting Wool Fineness in Karacabey Merino Sheep using Chaid and Mars Algorithms
Yasin Altay1, Saim Boztepe2, Ecevit Eyduran3, İsmail Keskin2
Mohammad Masood Tariq4*, Farhat Abbas Bukhari4 and Irshad Ali4
1Eskişehir Osmangazi University, Faculty of Agriculture, Department of Animal Science, Eskişehir, Turkey
2Selçuk University, Faculty of Agriculture, Department of Animal Science, Konya, Turkey
3Iğdır University, Faculty of Economics and Administrative Sciences, Department of Business Administration, Quantitative Methods, Iğdır, Turkey
4Center for Advanced Studies in Vaccinology and Biotechnology, University of Balochistan, Quetta, Pakistan
ABSTRACT
The purpose of this study was to capture some factors affecting wool fineness (WF) in Karacabey Merino. For this goal, CHAID (Chi-Square Automatic Interaction Detector) tree-based algorithm implemented to construct a regression tree diagram was specified based on Bonferroni adjustment within the scope of the prediction of wool fineness as a response variable. Also, Multivariate Adaptive Regression Splines (MARS) was implemented for the WF prediction. In the prediction of wool fineness (WF), sex, dam age (DA), birth weight (BW), birth type (BT), live body weight (LBW), greasy fleece weight (GFW), staple length (SL), number of fibers (F) and average number of crimps over a length of 5 cm (ANC) were considered as possible predictors. To guarantee the highest predictive accuracy of the CHAID algorithm, minimum animal numbers in parent and child nodes were thought as 4 and 2. Model fit statistics showed the powerful predictive performance of the CHAID and MARS algorithms, but MARS outperformed CHAID. Considering the regression tree diagram generated by CHAID algorithm, the most influential predictor affecting WF was F, followed by BW, ANC and DA at the 2nd significance degree, and SL at the 3rd significance degree, respectively. MARS predictive model with the selected 5 terms captured only F as a significant predictor. In conclusion, CHAID and MARS data mining algorithms reflected that F predictor may be considered as an indirect selection criterion in the characterization of the breed standards of the Karacabey Merino in wool characteristics for breeding goals.
Article Information
Received 29 March 2019
Revised 16 June 2019
Accepted 29 June 2019
Available online 26 February 2021
Authors’ Contribution
SB, IK and EE conceived and designed the study. EE, MMT, IA wrote the article. YA, MMT and FAB analyzed the data. IK helped in acquisition of data.
Key words
Wool fineness, Data Mining, Regression tree, Karacabey merino
DOI: https://dx.doi.org/10.17582/journal.pjz/20190329150359
* Corresponding author: tariqkianiraja@hotmail.com
0030-9923/2021/0002-0691 $ 9.00/0
Copyright 2021 Zoological Society of Pakistan
INTRODUCTION
In Turkey, sheep breeding activities were initiated on Merino sheep to improve yield and quality of indigenous breeds in the year 1933 by mating Merino rams with indigenous Turkish ewes. Thus, new sheep breeds i.e. Karacabey, Anatolia and Konya Merino sheep were developed. Among the breeds, Karacabey, found in north western Anatolia region of Turkey, was a new breed obtained by backcrossing German and Hungary rams with Kıvırcık sheep. Karacabey merino sheep breed (with Merino over 95%) has white-body, non-fat and thin-long tail and it has a fleece trait with medium wool quality. Karacabey Merino ewe’s body weight and fleece weight were 50-60 kg and 3-3.5 kg (Boztepe, 2015).
Thanks to studies on Merino sheep, a part of qualified wool production required for textile industry has been provided inasmuch as a qualified cloth is produced by the qualified wool. Fineness is one of the most important wool quality characteristics and the quality and price generally increase as the wool become thin (Kaymakçı and Sönmez, 1992).
Knowledge of the linear, non-linear and interaction relationships between the wool characteristics is indispensable not only in disclosing breed standards of the assessed breed, Karacabey Merino sheep, but also in more profitable sheep production. Trustworthiness of the knowledge is connected with choosing correct and robust statistical techniques (Eyduran, 2016) i.e. tree-based algorithms i.e. Classification and Regression Tree (CART) (Kovalchuk et al., 2017), Chi-Square Automatic Interaction Detection (CHAID) (Orhan et al., 2016; Akin et al., 2017a, b, c), Exhaustive CHAID (Eyduran et al., 2013), Multivariate Adaptive Regression Splines (MARS) and artificial neural network algorithms (Aytekin et al., 2018). Trees constructed by tree based algorithms are called classification tree for a categorical response variable and regression tree for a continuous response variable (Sümbüloğlu and Akdağ, 2007). Among those, CHAID constructs an understandably decision tree diagram that allows to visually present the evaluated data and to capture interactions among influential predictors that affect a response continuous variable (Aksahan and Keskin, 2015). CHAID algorithm uses F significance test and makes the Bonferroni adjustment to calculate adjusted P values at split points of the regression tree generated for the continuous response with a V-tenfold cross validation. MARS is a non-parametric regression technique describing a complex relationship between the response variable and predictors (Aytekin et al., 2018).
There are some earlier publications on describing factors affecting the wool characteristics at various sheep breeds. For example, Tariq et al. (2013) examined the effect of gender, type of birth, and flock location etc. on fleece characteristics. The influence of environmental factors on some wool characteristics was reported for Akkaraman and Malya sheep by Colakoglu and Ozbeyaz (1999). Eyduran et al. (2013) employed CHAID tree-based algorithm to predict the fleece weight from fleece weight (FW), staple length (SL), fiber length (FL), average number of crimps over a length of 5 cm (ANC) and wool fineness (WF) for Akkaraman and Awassi ewes at 2-yr age and highlighted that knowledge of the relationship between wool characteristics is significant but still not enough in literature. MARS and CHAID tree-based modeling studies are also scarce in the prediction of wool fineness by means of effective environmental factors and some wool characteristics. Therefore, the main aim of the present investigation was to predict wool fineness from some environmental factors and wool characteristics through MARS and CHAID tree-based modeling within the scope of indirect selection criteria.
MATERIALS AND METHODS
Data collection
In this study, 156 Karacabey Merino sheep at yearling age were used. The data on sex, dam age (DA), birth weight (BW), birth type (BT), live body weight (LBW), greasy fleece weight (GFW), staple length (SL), number of fibers (F) and average number of crimps over a length of 5 cm (ANC) were considered as potential predictors were recorded from the Merino sheep in order to predict wool fineness (WF).
Statistical analysis
Student t test is used to compare two independent groups in a quantitative trait (Gecer et al., 2016). One-way ANOVA is specified to compare two or more independent groups in a continuous trait (Eyduran et al., 2015a, b, c). Two-way ANOVA is to capture the effect of two factors on the response trait at randomized block design, or the effect of two factors and their interaction on the response trait at factorial design. Within the framework of General Linear Model (GLM) that can include factors and covariates, CHAID algorithm can be implemented to predict a continuous response trait (Eyduran et al., 2008).
The CHAID tree-constructing steps are merging, splitting and stopping. The CHAID algorithm describes optimal split on the basis of chi-square statistics when the response variable is categorical, and F-test is specified for a continuous response variable. Predictors are tested for significance (which is generally an alpha level of 0.05). If the p-value is greater than the specified alpha level, the categories are merged into a single subset. The optimal split for each predictor is described in the merging step. The splitting step describes that the predictor is going to be used for optimal node splitting. Adjusted p-values of predictors are compared and the predictor with the smallest adjusted p-value (i.e., most significant) is chosen. If the adjusted p-value is less than or equal to the specified alpha-level the node is split, else it remains undivided as a terminal node. The tree growing process stops when the tree depth reaches the predefined minimum parent and child node size (Akin et al., 2018; Rashidi et al., 2014).
CHAID algorithm solely utilizes nominal or ordinal predictors and continuous predictors are converted into ordinal predictors in order to specify the following algorithm. For a given set of break points a1, a2…,ak-1 (in ascending order), a recognized x is mapped into category C(x) herein below:

1
When K is the chosen number of bins, for the approximation of the break points xi frequency weights are unified in computing the ranks. In the case of being ties, the average rank is specified. The rank and the corresponding values in ascending order can be described as {r(i), x(i)}ni=1
For k = 0 to (K−1), set
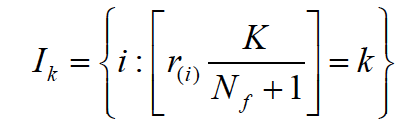
Where (x) represents the floor integer of x. If Ik is not empty, ik= max {i : i ϵ Ik} The adjustment is made for the break points by equalizing to the x values corresponding to the ik, not including the largest (Breiman et al., 1984).
The MARS model can be rewritten as follows:
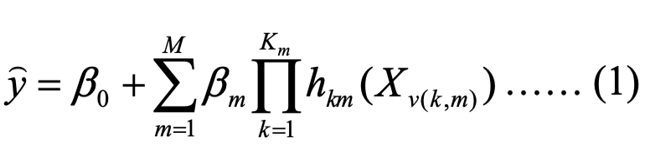
Where; ͡y is the predicted value of the response variable (WF), β0, is an intercept, βm is the coefficients of basis functions, hkm (Xv (k, m)) is the basis function, where v(k, m) is an index of the predictor for the mth component of the kth product, Km is the parameter controlling the order of interaction.
After building the most complex MARS model, the basis functions that did not contribute much to the model fitting performance were eliminated in the pruning process based on the following generalized cross-validation error (GCV) (Kornacki and Ćwik, 2005).

Where: n is the number of training cases, yi is the observed value of a response variable, yip is the predicted value of a response variable (WF), M(λ) is a penalty function for the complexity of the model with λ terms.
Goodness of fit criteria for computing predictive performances of the CHAID and MARS algorithms are presented as follows:
Pearson correlation coefficient (r) between the actual and predicted WF values,
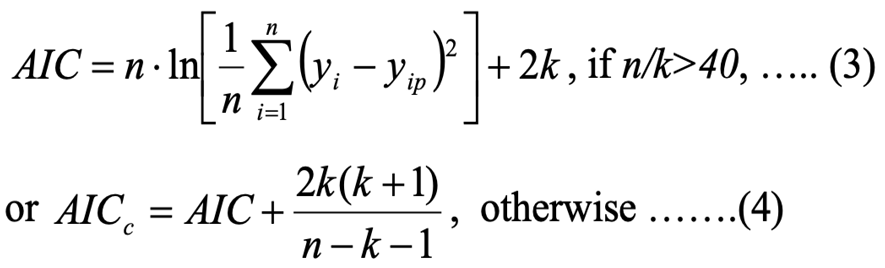
Akaike Information Criterion (AIC) calculated as:
Root-mean-square error (RMSE) given by the following formula:

Global relative approximation error (RAE):
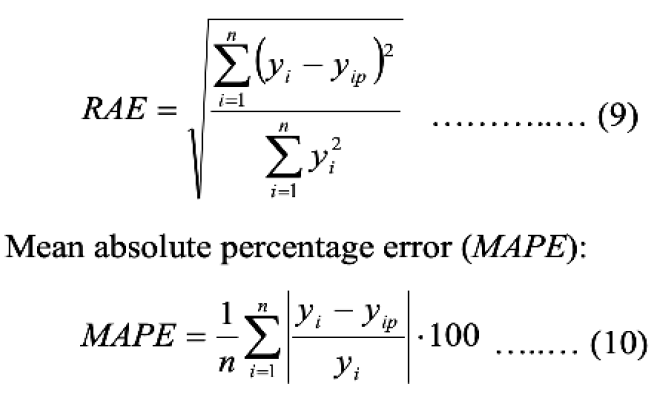
where: n – the number of cases (plants or animals) in a set, k – the number of model parameters (number of the selected terms in R), yi – the real value of a response variable, yip – the predicted value of a response variable, sm – the standard deviation of model errors, sd – the standard deviation of a response variable.
Greater is better in square of the Pearson’s correlation coefficient which is defined as coefficient of determination (R2). Adjusted R2 is defined as follows

Where n is sample size and k is number of terms in the MARS model (Eyduran et al., 2019).
To guarantee the highest predictive accuracy of the CHAID algorithm as a growing method, minimum animal numbers in parent and child nodes were thought as 4 and 2 for the greatest predictive accuracy at 10 cross-validation. Tree depth of the CHAID was set at 3 by default (Koc, 2016). All the statistical computations regarding CHAID tree-based algorithm were performed by IBM SPSS 23 software. For MARS modeling with no interaction effect, the earth package in R was specified at 10 cross-validation through penalty=2, which prevents overfitting problem (Milborrow, 2011; Milborrow, 2018). To compute goodness of fit criteria mentioned above, the codes in the R software were written (R Core Team, 2014).
RESULTS AND DISCUSSION
When the risk estimates of re-substitution cost and cross-validation cost were the closest for the CHAID data mining algorithm, the optimal regression tree diagram was constructed based on model fit criteria i.e. 0.956 R2, 0.955 adjusted R2, 0.377 RMSE, 0 ME, 0.018 RAE, 1.117 MAPE, 0.237 MAD, -293. 974 AIC, -293.574 AICc and 0.21 SD ratio. In the WF prediction of yearling Karacabey Merino sheep, the regression tree diagram formed by CHAID tree-based algorithm is depicted in Figure 1. Practically all of the variability of the WF was accounted for by the predictors entered into CHAID regression tree structure. The measured WF values had the approximately highest agreement with the WF values predicted by CHAID tree-based algorithm (r=0.978, P<0.01). In this respect, the CHAID was preferred for the phenotypically characterizing the yearling Merino sheep in the wool characteristics with a very big accuracy. The cut-off values of the statistically significant predictors differentiating the Merino sheep in wool traits in the tree structure may be remarkable indications for producers who postulate to develop sheep breeding approaches and provide more profitable sheep production.
At the top of the regression tree structure, Node 0 includes all of 156 sheep in the study and an overall mean of WF was 21.307 (S=1.806) micron. Node 0 was split into ten smaller subgroups (Nodes 1-10), available at the first tree depth, according to F trait. Among them, Nodes numbered 2, 3, 4, 5, 7, 9 and 10 were terminal nodes that were not influenced by any predictor at the second and third tree depths of the regression tree structure constructed here. As F increased from Node 1 through Node 10, it was understood from Figure 1 that the thinnest WF average was achieved with the range of 24.620 to 18.250 micron. At the first tree depth, it could be said that there was a reverse relationship between F and WF in the yearling Karacabey Merino sheep. Node 1, which was a subgroup of the yearling Merino sheep with F ≤ 87, had an average of 24.620 micron in WF. Nodes 11-16 were formed by BW, ANC and DA at the second tree depth, respectively. These three predictors had the second degree significance on WF.
Node 1 was divided by BW trait into two smaller subgroups viz. Node 11 (the subgroup of the yearling Merino sheep with F ≤ 87 and BW ≤ 3.8 kg) and Node 12 (the subgroup of the yearling Merino sheep with F ≤ 87 and BW > 3.8 kg), (26.450 vs. 24.338 micron in WF). Node 12 had averagely 2.112 micron in WF thinner than Node 11.
The thickest average WF predicted here was obtained by Node 11 in the regression tree structure. In this respect, 87 F and 3.8 BW may be the significant cut-off values. It was demonstrated that Nodes 2-5, the subgroups of those with 87 < F ≤ 108, were not influenced by any predictor. However, Node 6 represented the subgroup of the yearling Merino sheep with 108 < F ≤ 114 (20.977 micron in WF) and was divided by ANC into two smaller subgroups; namely, Node 13 (the subgroup of the yearling Merino sheep with 108 < F ≤ 114 and ANC ≤ 9.0) and Node 14 (the subgroup of the yearling Merino sheep with 108 < F ≤ 114 and ANC > 9.0) in the regression tree structure (20.800 vs. 21.009 in WF). Then Node 14 was split by SL into two smaller subgroups (Nodes 17 and 18) in the regression tree construction (21.100 vs. 20.989). Node 17 symbolized the subgroup of the yearling Merino sheep with 108 < F ≤ 114, ANC > 9.0 and SL ≤ 70, whereas Node 18 symbolized the subgroup of the yearling Merino sheep with 108 < F ≤ 114, ANC > 9.0 and SL > 70.
The subgroup of the yearling Karacabey Merino sheep with 118 < F ≤ 124 was included in Node 8 (20.111 micron in WF). Node 8 was divided by DA into two smaller subgroups numbered Nodes 15 and 16. Node 15 represented the subgroup of the yearling Karacabey Merino sheep with 118 < F ≤ 124 and DA of 2, 3, 5 and 6 ages, whereas Node 16 represented the subgroup of the yearling Karacabey Merino sheep with 118 < F ≤ 124 and DA of 1 and 4 ages. The thinnest WF average was produced by Node 10, as the subgroup of those with F > 135.
It was determined that MARS model with no interaction effects was the best for the highest predictive accuracy based on all model fit statistics estimated as: 0.993 R2, 0.993 adjusted R2, 0.155 RMSE, 0 ME, 0.007 RAE, 0.432 MAPE, 0.093 MAD, -572 AIC, -571 AICc and 0.086 SD ratio.
The following MARS prediction model with the selected 5 terms is
WFPREDICT= 20.506 + 0.039*max(0, F– 89) + 0.146*max(0, 108 – F) – 0.121*max(0, F – 108) + 0.034*max(0, F-139)
Regardless of the remaining insignificant predictors except for F, let’s predict the WF value of a yearling Karacabey Merino sheep with F=100,
WFPREDICT= 20.506 + 0.039*max(0, 100– 89) + 0.146*max(0, 108 – 100) – 0.121*max(0, 100 – 108) + 0.034*max(0, 100-139)
WFPREDICT= 20.506 + 0.039*max(0, 11) + 0.146*max(0, 8) – 0.121*max(0, –8) + 0.034*max(0, –39)
Where max(0, –8) = 0 and max(0, –39)=0. In conclusion,
WFPREDICT = 20.506 + 0.039*max(0, 11) + 0.146*max(0, 8)
WFPREDICT = 20.506 + 0.039*11 + 0.146*8=20.506 + 0.429 + 1.168 = 20.935 micron.
Table I presents significance tests of the intercept and coefficients estimated for MARS model obtained above. All the coefficients were found significantly (P<0.001). Some cut-off values (89, 108 and 139) for F trait in the MARS model were obtained, which may be noteworthy signs for wool breeding studies.
Table I. The estimated coefficients and significance tests of MARS model.
|
Estimate |
Std. Error |
t value |
Pr(>|t|) |
|
|
(Intercept) |
20.506454 |
0.102933 |
199.221 |
< 2e-16 *** |
|
max(0,F-108) |
-0.121055 |
0.006781 |
-17.851 |
< 2e-16 *** |
|
max(0, 108-F) |
0.145797 |
0.004246 |
34.341 |
< 2e-16 *** |
|
max(0, F-139) |
0.033562 |
0.003886 |
8.635 |
7.7e-15 *** |
|
max(0, F-89) |
0.039101 |
0.005943 |
6.579 |
7.3e-10 *** |
Signif. Codes, 0; ***, 0.001; **, 0.01; *, 0.05;‘.’ 0.11; Residual standard error, 0.1574 on 151 degrees of freedom; Multiple R-squared, 0.9926; Adjusted R-squared, 0.9924; F-statistic, 5059 on 4 and 151 DF; p-value, < 2.2e-16.
Pearson correlation coefficient between measured WF values and the WF values predicted by MARS modeling was found as 0.996 (P<0.01). Here, only a significant predictor (F) for MARS modeling was captured and the remaining predictors were excluded from MARS predictive model. As mentioned above, it is clear that, the MARS produced the flexible and practical model. For instance, the above MARS predictive model for the subgroup of Merino sheep with F < 89, which is also expressed as the subgroup corresponding to Node 1 in the CHAID tree-based algorithm, is converted into WFPREDICT= 20.506 + 0.146*max (0, 108 – F).
Genetic correlation between WF and F must be estimated to confirm comments regarding F in the wool characterization of the examined Karacabey Merino sheep. If genetically confirmed, F can be considered as an indirect selection criteria. However, it could be taken into consideration that the effect of F on WF, as also seen from Nodes 1, 6 and 8, could be changed by BW, ANC, and DA predictors interacted with F. Besides, CHAID classified animals with the ideal WF or the worst WF in Karacabey Merino sheep by ensuring the high predictive accuracy in WF prediction.
To make accurate comments, we still needs much more sophistical techniques i.e. CHAID, ANNs and especially MARS in contrast to the previous studies in which routine statistical methods were used (Aytekin et al., 2018). It is important for a good selection strategy to reveal environmental factors that can affect tool traits. The current CHAID results captured significant environmental factors for WF in contrast to the MARS result. However, MARS allows ones to simultaneously analyze multi responses as a statistical background compared to the CHAID.
Kucuk et al. (2000) mentioned that age was a significant factor for wool traits. Tariq et al. (2013) reported that birth type and sex were non-significant for fleece traits. These two factors were observed to be also nonsignificant sources of variation in our current study. Kucuk et al. (2000) emphasized great importance of the relationship between some wool traits i.e. med-fibers, fiber’s diameter, elasticity and length for Turkish breeds in the development of carpet industry. Eyduran et al. (2013) utilized CHAID tree-based algorithm to predict fleece weight (FW) from several wool traits i.e. SL, ANC, WF and FL (fiber length) in Akkaraman and Awassi ewes at 2 yr. and obtained the heaviest average (3.470 kg) for Awassi sheep with FW SL >13 and FL≤15. They informed that, no influential predictor was recorded for the FW of Akkaraman ewes and, breed factor was the most influential predictor for the FW.
In agreement with the present statements, they mentioned CHAID in terms of phenotypically characterizing the wool traits and genetically finding indirect selection criteria. However, the studied traits were different from those evaluated in our study. Eyduran (2016) highlighted that MARS algorithm may be a statistically extraordinary preference for one or multiple continuous response models in small ruminant investigations and also implemented for the data set of the optimal design with a response surface methodology (RSM). To date, use of MARS algorithm without the validity of the distributional assumption of the included variables is, therefore, scarce for predicting WF. Within this context, applicability of the MARS data mining approach as a novel approach to the wool data is of great interest. The difference is attributable to the variability in sheep breed, the studied traits, sample size, interaction effects, nutritional status, and statistical techniques.
CONCLUSION
WF is the most important trait that affects quality and price in wool. In this respect, there is a growing interest for the determination of the influential factors. As highlighted in the study, the sophistical data mining approaches are more useful tools to determine the causal relationship between the wool traits, and but may be gained significance for further studies. In further studies, the relationship between phenotypic values and breeding values of the sheep in WF can be revealed for sheep breeding strategies through CHAID and MARS algorithm. Also, the effect of inbreeding on WF can be evaluated by the algorithms. If ideal goodness of fit is provided as also obtained in the present study, a special MARS model can be developed for each Node of the CHAID, as a new approach.
Statement of conflict of interest
The authors have declared no conflict of interest.
REFERENCES
Akin, M., Eyduran, E. and Reed, B.M., 2017a. Use of RSM and CHAID data mining algorithm for predicting mineral nutrition of hazelnut. Pl. Cell Tiss. Organ Cult., 128: 303-316. https://doi.org/10.1007/s11240-016-1110-6
Akin, M., Eyduran, E. and Reed, B.M., 2017b. Developing of optimal tissue culture medium for Hazelnuts. IX. International Congress on Hazelnut, 15-19 August, Atakum, Samsun, Turkey.
Akin, M., Eyduran, E. Niedz, R.P. and Reed, B.M., 2017c. Developing hazelnut tissue culture medium free of ion confounding. Pl. Cell Tiss. Cult., 130: 483-494. https://doi.org/10.1007/s11240-017-1238-z
Akin, M., Hand, C., Eyduran, E. and Reed, B.M., 2018. Predicting minor nutrient requirements of hazelnut shoot cultures using regression trees. Pl. Cell Tiss. Cult., 132: 545-559. https://doi.org/10.1007/s11240-017-1353-x
Aksahan, R., Keskin, I., 2015. Determination of the somebody measurements effecting fattening final live weight of cattle by the regression tree analysis. Selçuk Tarım Bilimleri Dergisi, 2: 53-59.
Aytekin, I., Eyduran, E., Karadas, K., Akşahan, R. and Keskin, I., 2018. Prediction of fattening final live weight from some body measurements and fattening period in young bulls of crossbred and exotic breeds using mars data mining algorithm. Pakistan J. Zool., 50: 189-195. https://doi.org/10.17582/journal.pjz/2018.50.1.189.195
Boztepe, S., 2015. Koyun Yetiştiriciliği. Selçuk Üniversitesi Basımevi, Konya.
Breiman, L., Friedman, J.H., Olshen, R.A. and Stone, C.I., 1984. Classification and regression trees. Wadsworth, Belmont, California, USA.
Colakoglu, N. and Ozbeyaz, C., 1999. Comparison of some production traits in Malya and Akkaraman sheep. Tr. J. Vet. Anim. Sci., 23: 351-360.
Eyduran, E., Karakus, K., Keskin, S. Cengiz, F., 2008. Determination of factors influencing birth weight using regression tree (RT) method. J. appl. Anim. Res., 34: 109-112. https://doi.org/10.1080/09712119.2008.9706952
Eyduran, E., Yilmaz, I., Kaygisiz, A. and Aktas, Z.M., 2013. An investigation on relationship between lactation milk yield, somatic cell count and udder traits in first lactation Turkish Saanen goat using different statistical techniques. J. Anim. Pl. Sci., 23: 731-735.
Eyduran, S.P., Akin, M., Ercisli, S., Eyduran, E. and Maghradze, D., 2015a. Sugars, organic acids, and phenolic compounds of ancient grape cultivars (Vitis vinifera L.) from Igdir province of Eastern Turkey. Biol. Res., 48: 1–8. https://doi.org/10.1186/0717-6287-48-2
Eyduran, S.P., Akin, M., Ercisli, S. and Eyduran, E., 2015b. Phytochemical profiles and antioxidant activity of some grape accessions (Vitis spp.) native to Eastern Anatolia of Turkey. J. appl. Bot. Fd. Qual., 88: 5-9.
Eyduran, S.P., Ercisli, S., Akin, M., Beyhan, O., Gecer, M.K., Eyduran, E. and Erturk, Y.E., 2015c. Organic acids, sugars, vitamin C, antioxidant capacity and phenolic compounds. J. appl. Bot. Fd. Qual., 88: 134-138.
Eyduran, E., 2016. The Possibility of using data mining algorithms in prediction of live body weights of small ruminants. Adv. Cal Anal Sci., 1:18-21.
Eyduran, E., Akin, M., Eyduran, S.P., 2019. Application of multivariate adaptive regression splines in agricultural sciences through R software. Nobel Academic Publishing (in English), pp. 112. ISBN: 978-605-2149-81-2, Ankara, Turkey.
Gecer, M.K., Akin, M., Gundogdu, M., Eyduran, S.P., Ercisli, S., and Eyduran, E., 2016. Organic acids, sugars, phenolic compounds, and some horticultural characteristics of black and white mulberry accessions from Eastern Anatolia. Canadian J. Pl. Sci., 96: 27-33. https://doi.org/10.1139/cjps-2015-0070
Kaymakçı, M., Sönmez, R., 1992. Koyun Yetiştiriciliği. Hasad Yayıncılık, İstanbul.
Koc, Y., 2016. Application of regression tree method for different data from animal science. Msc. Thesis. Igdir Univ. Igdir, Turkey.
Kornacki, J. and Ćwik, J., 2005. Statistical learning systems. WNT, Warsaw, Poland.
Kovalchuk, I.Y., Mukhitdinova, Z., Turdiyev, T. Madiyeva, G., Akin, M., Eyduran, E., and Reed, B.M., 2017. Modeling some mineral nutrient requirements for micropropagated wild apricot shoot cultures. Pl. Cell Tiss. Organ Cult., 129: 325- 335. https://doi.org/10.1007/s11240-017-1180-0
Kucuk, M., Yilmaz, O. and Ates, C.T., 2000. The evaluation of Morkaraman, Hamdani, Karagul wool for carpet wool type. Van Vet. J., 11: 54-59.
Milborrow, S., 2011. Derived from mda:mars by T. Hastie and R. Tibshirani. Earth: Multivariate Adaptive Regression Splines, 2011. R package.
Milborrow, S., 2018. Notes on the earth package. pp. 1-64. http://www.milbo.org/doc/earth-notes.pdf
Orhan, H., Eyduran, E., Tatliyer, A. and Saygici, H., 2016. Prediction of egg weight from egg quality characteristics via ridge regression and regression tree methods. R. Bras. Zootec., 45: 380-385. https://doi.org/10.1590/S1806-92902016000700004
R Core Team., 2014. R: A language and environment for statistical computing. R Foundation for Statistical Computing, 2014. http://www.R-project.org.
Rashidi, S., Ranjitkar, P. and Hadas, Y., 2014. Modeling bus dwell time with decision tree-based methods. Transportation research record. J. Transpor. Res. Bd., 2418:74-83. https://doi.org/10.3141/2418-09
Sümbüloğlu, K. and Akdağ, B., 2007. Regresyon Yöntemleri ve Korelasyon Analizi, Hatiboğlu Yayınevi. Ankara.
Tariq, M.M., Bajwa, M.A., Javed, K., Rafeeq, M., Awan, M.A., Rashid, N., Waheed, A., Amin, S., Khan, M.A. and Bukhari, F.A., 2013. Assesment of wool characteristics of Mengali sheep of Balochistan. J. Anim. Pl. Sci., 23: 721-726.
To share on other social networks, click on any share button. What are these?


