


Research Article
Morphological Evaluation and Multivariate Analysis of Soybean Glycine max (L.) Merrill Genotypes in Western Mid-Hills of Nepal
Anjali Khadka1*, Subodh Raj Pandey2, Subarna Sharma Acharya3, Amrit Poudel4 and Sushma Adhikari1
1Lamjung Campus, Institute of Agriculture and Animal Science, Tribhuvan University, Nepal; 2Agriculture and Forestry University, Rampur, Chitwan, Nepal; 3Asst. Professor, Department of Agronomy and Plant Breeding, Institute of Agriculture and Animal Science, Tribhuvan University, Nepal; 4Regional Agriculture Research Station (RARS), Lumle, Pokhara, Nepal.
Abstract | With the aim to study morphological variances along with association and contribution of traits on yield, the varietal trial was performed at Regional Agricultural Research Station (RARS), Lumle, Kaski, Nepal. Sixteen soybean genotypes were placed out in a randomized complete block design with three replications. According to mean performance, the genotypes F778817, G-1873 and KAVRE performed better and were found high yielding. Phenotypic coefficient of variation was found to be higher than the genotypic coefficient of variation for all traits. Most of the traits observed were moderate to highly heritable accompanied by the desirable level of genotypic and phenotypic coefficient of variations and genetic gain, indicating that the heritability was most likely due to additive gene effects and selection may be effective. High heritability for days to maturity, moderate heritability for days to 50% flowering with low genetic advance and genotypic and phenotypic coefficient of variation for both of the above traits were observed. Test weight had a significant positive correlation with grain yield. Number of nodes, basal pod height, internodal length, plant height, number of branches, number of grains, pod length at maturity, leaf area was positively correlated with grain yield while days to 50% flowering, days to maturity, number of trifoliate, number of pods and fresh weight of the pod were negatively correlated with grain yield. The path analysis depicts that the internodal length and days to maturity had the highest direct positive and negative effect on yield respectively. Though test weight had a significant positive correlation with grain yield, it had a negative direct effect on grain yield. The cluster analysis grouped sixteen genotypes into four clusters among which cluster I was largest with eight genotypes.
Received | May 12, 2020; Accepted | November 12, 2020; Published | January 31, 2021
*Correspondence | Anjali Khadka, Lamjung Campus, Institute of Agriculture and Animal Science, Tribhuvan University, Nepal; Email: khadkaanjali123@gmail.com
Citation | Khadka, A., S.R. Pandey, S.S. Acharya, A. Poudel and S. Adhikari. 2020. Morphological evaluation and multivariate analysis of soybean Glycine max (L.) Merrill genotypes in western mid-hills of Nepal. Sarhad Journal of Agriculture, 37(1): 77-91.
DOI | http://dx.doi.org/10.17582/journal.sja/2021/37.1.77.91
Keywords | Cluster, Correlation, Genetic advance, Heritability, Path coefficient
Introduction
The cultivated soybean, Glycine max (L.) Merrill (2n=40) is a self-pollinated crop belonging to family Leguminosae and falls under the subgenus Soja (Moench). Soybean was generally called a golden bean, miracle bean, crop of the planet, god´s sent golden bean and greater bean. It has become the leading crop in world agriculture economy and has been important provider as human food and animal feed because it contains high-quality vegetable oil (20%), carbohydrate/soluble sugars (35%), ash (5%) and protein (40%). Among food legumes, it comes next to groundnut in terms of oil content whereas it is the cheapest source of protein as compared to other protein-rich sources such as meat, fish, and eggs (IITA, 2000). This bean was a vital source of cheaper yet high-quality protein (IITA, 1992a). Highly digestible with zero cholesterol oil can be extracted from soybean (IITA, 1992b).
This bean was found to be a benchmark nitrogen-fixing legume which can fix up to 180kg N/ha symbiotically, 80% of which was harvested as beans. Soybean has great demand in the world market due to its use as a major ingredient in formulations of various industrial goods, foods and feeds. The high amount of soy foods and feeds replace dairy products and meat products as well as high-value secondary co-products such as lecithin, vitamins, nutraceuticals and anti-oxidant (Balla and Ibrahim, 2017). The seeds leftover was used to make high protein meal and supplement to cereal seeds in feed for poultry and dairy/ beef animal. The protein content in soybean has many health-related advantages like decrease in levels of cholesterols, reduce menopause symptoms and decrease the risk of having several chronic diseases i.e. cancer, heart disease and osteoporosis. The isoflavones which are named as daidzein and genistein found in soybean help in decreasing cholesterol level, reduce the risk of cancers and also check the possibility of osteoporosis and cure it (Aditya et al., 2011).
Soybean can be grown successfully at an altitude ranging from 500 to 1500 masl indicating its diverse adaptability to varied climatic and agro-ecological conditions (Darai et al., 2016). In terms of acreage and production, it was ranked as the third most important grain legume of Nepal after lentil and black gram. It covers 80% in mid-hills (Darai et al., 2016). It has been cultivated either in rice bund or has been intercropped with crops like maize in mid-hills of Nepal and green pods soybean has been eaten as vegetables or it has been consumed as the roasted bean. Soybean which has been the important ingredient of poultry feed has especially great potential for commercial cultivation in terai/inner terai (Darai et al., 2016).
The average area of production of soybean in the world is 124,921,956 ha with a production of 348,712,311 tons i.e. average productivity of 2.79 tons/ha in 2018 (FAOSTAT, 2020). In the context of Nepal, the average area of production is 22,615,000 ha with a production of 29,176,000 tons i.e. average productivity of 1.29 tons/ha (MoF, 2019). Similarly, in Kaski district of Nepal, the average area of production was 328 ha which produced 371 tons with an average productivity of 1.132 tons/ha (MoALD, 2017). The average production and productivity of Nepal were less than the global average, so the identification and improvement of soybean genotype could increase the production. Thus, productivity should be increased in the study area.
Therefore, this research was carried out to study variations among different genotypes and identify the best suitable varieties for agro-ecological conditions of the study site. Likewise, this study includes a grouping of varieties through cluster analysis based on their similarity level and this study also helps to understand the correlation between yield attributing traits with yield and among traits along with identifying the way they affect the grain yield. It also includes the study of genotypic and phenotypic variability and estimates the phenotypic and genotypic coefficient of variation, heritability and genetic advance of some yield and yield-related traits.
Materials and Methods
Experimental site
This research was conducted under rainfed condition in Bhojpurbari (research block) of Regional Agricultural Research Station (RARS), Lumle, Kaski. It was located in Pokhara Baglung highway which is 31 km west of Pokhara. This research station lies at an altitude of 1740 meters above mean sea level in the south-facing slopes. It is located at 28.29° north and 83.81° east coordinates.
Experimental details
Research design: For this experiment, Randomized Complete Block Design (RCBD) was used with sixteen soybean genotypes as treatments and they were replicated three times.
Plots: The total numbers of plots used in the research were 48 with a single plot of 9 m2. The single replication or block covers 144 m2 areas.
Seed sowing: Seed were sown on 8th July 2017 during the monsoon period and sowing was done at the rate of two seeds per hill manually with the crop geometry of 50cm*10 cm (row to row * plant to plant). Each genotype was sown in six rows each of 3m length. Thinning out extra plants was undertaken after first weeding. The full dose of nitrogen (N), phosphorous (P2O5) and potassium (K2O) were given as basal dose.
Intercultural operations: First manual weeding was done at 35 DAS. Hoeing was done at 60 DAS. The earthing up and second manual weeding were done one month after hoeing.
Genotypes used: All of the genotypes used in this experiment were obtained from RARS, Lumle. Kavre and Pooja were standard check against fourteen promising pipeline soybean genotypes (Table 1).
Table 1: List of different soybean genotypes used in the study, 2018.
|
S. No. |
Genotypes |
S. No. |
Genotypes |
|
1 |
P194159 |
9 |
AGS371 |
|
2 |
LS77-16-16 |
10 |
G-1873 |
|
3 |
IARS87-1 |
11 |
TG1989-41F |
|
4 |
SBO-122 |
12 |
TGX1990-4904L |
|
5 |
AGS376 |
13 |
TGX1989-21F |
|
6 |
TGX1418-1D |
14 |
TGX1987-62F |
|
7 |
F778817 |
15 |
KAVRE (Standard Check) |
|
8 |
SB0-115 |
16 |
PUJA (Standard Check) |
Data recorded: All the data were obtained from central four rows excluding the border plants.
Days to 50% flowering: It is the numbers of days from sowing to 50% plant population in a plot bear flowers.
Number of trifoliate: The number of trifoliate was counted after complete flowering (90 DAS) from each of fifteen randomly selected plants from a plot and average value was calculated.
Leaf area: The leaf area from the leaf samples was measured after complete flowering (90 DAS) from two random leaves from each plant. To calculate the length (cm) of the leaf, it was measured from base of the leaf to tip of margin whereas width (cm) was taken from base, middle portion and the edge portion of the leaf then the average value of width was calculated. Thereafter, leaf area was calculated by taking the product of average width with length. Finally, the average area (cm2) of thirty leaves was taken from fifteen randomly selected plants.
Internodal distance (cm): First two internodal distances (cm) were taken from the basal node after complete flowering (90 DAS) and the average value was calculated.
Basal pod height (cm): Height of first basal pod was taken as the distance (cm) from basal node to the plant level where pod formation had started and the average value was calculated.
Plant height (cm): Plants height was measured as the distance (cm)from the base of the plant to the top of the main axis at maturity and the average value was calculated.
No of branches: No of branches at maturity were counted and the average value was calculated.
Moisture (%) at harvest: The moisture percentage (%) was recorded using a moisture meter.
Pod length at maturity (cm): The average length of two pods from each plant (from the tip of one end to tip of another end) was taken immediately after maturity and harvest and the average value was calculated.
Number of pods per plant: The total number of pods per plant was recorded and the average value was calculated.
Number of grains per plant: The total number of grains per plant was recorded and the average value was calculated.
Fresh weight of pod (g): The pod weight of total pods of each plant was measured after harvesting and the average value was calculated.
Test weight (kg): Thousand seed weight of samples were recorded along with their moisture content by using the moisture meter.
Grain yield (tons/ha): The grain yield per hectare was calculated for each treatment from the net plot yields.
Statistical analysis
Data entry and analysis: The collected data were recorded in MS-Excel and analyzed using analysis of variance (ANOVA) to determine if the treatments have any significant differences with each other using R-studio 1.0.143. The Statistical Package for the Social Sciences (SPSS)-25 and MS-Excel was used for correlation and path analysis. Likewise, MS-Excel was used to calculate the phenotypic and genotypic coefficient of variance, heritability and genetic advance. Similarly, Minitab-19 was used for cluster analysis.
Genotypic and phenotypic coefficient of variation
The genotypic variance, phenotypic variance, genotypic coefficients of variation and phenotypic coefficient of variation were calculated by the following methods.
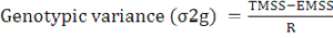
(Lush, 1940; Chaudhary and Prasad, 1968)
Where,
TMSS: Treatment mean sum of square; EMSS: Error mean sum of square; R: Number of replication.
Error variance = σ2e
Phenotypic variance (σ2p) = σ2e+σ2g
Genotypic coefficient of variation (GCV) = σg/x× 100
Phenotypic coefficient of variation (PCV) = σp/x × 100
Where,
σg: Genotypic standard deviation; σp: Phenotypic standard deviation; X: General mean of the trait.
Sivasubramanjan and Menon (1973) categorised the value of GCV and PCV as low (0-10%), moderate (10-20%) and high (>20%).
Broad sense heritability (hbs2)
Mathematically, the ratio of genotypic variance (Vg) to the phenotypic variance (Vp) is called broad sense heritability. It is expressed in percentage (Hanson et al., 1956).
Heritability in the broad sense for all characters was computed by the given formula.
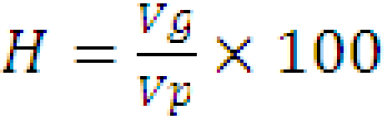 (
(Where,
H: heritability in broad sense; Vp: phenotypic variance; Vg: genotypic variance.
Robinson et al. (1949) categorized heritability into low (0-30%), moderate (30-60%) and high (˃60%). Genetic advances (GA) and genetic advance as percent of mean.
The expected genetic advances for each character at 5% selection intensity were computed by the given formula.
Genetic Advances (GA) = k.σp.H (Johnson et al., 1955)
Where,
K: Constant (selection differential where k= 2.056 at 5% selection intensity); σp: Phenotypic standard deviation; H: Broad sense heritability.
Genetic advances as percent of mean were calculated to compare the extent of predicted advances of different traits under selection, using the formula.
GAM = GA/X *100
Where;
GAM: Genetic advances as percent of mean; GA: Genetic advances under selection; X= Mean of population in which selection will be employed.
The GA as the percent of mean (GAM) was categorized into low, moderate and high. 0-10%, 10-20% and ≥20% was identified as low, moderate and high respectively (Johnson et al., 1955).
Correlation
The variance and covariance components were used to determine the genotypic and phenotypic correlation between the two characters.
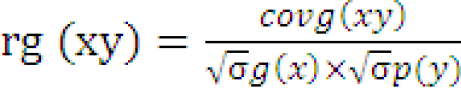 (
(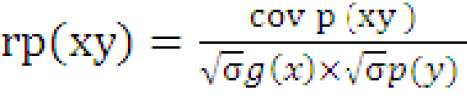 (
(Where,
rg (xy) and rp(xy) are genotypic and phenotypic correlation coefficients respectively; covg (xy) and covp (xy) are genotypic and phenotypic covariance of xy respectively; σ1/2g(x), σ1/2 p(x) and σ1/2 g(y), σ1/2 p(y) are genotypic and phenotypic standard deviations of x and y respectively.
This coefficient of correlation was tested for their statistical significance using ‘t’ test as:
Where;
n: number of treatments; The calculated and tabulated ‘t’ value was compared at n-2 degrees of freedom at 1 and 5 percent level of significance.
Results and Discussion
Evaluation of genotypes through morphological traits
Days to 50% flowering: Days to 50% flowering ranged from 68 (LS77-16-16) to 87.6 days (TGX1987-62F). The mean days to 50% flowering were 77.75 days and six genotypes exceeded the general mean. Genotypes TGX1987-62F and KAVRE were at par and showed late flowering as compared to other genotypes which were found statistically significant at 1% level (Table 2).
Fresh weight of the pod
The fresh weight of the pod ranged from 91.2 (LS77-16-16) to 280g (TGS1989-41F). The mean fresh weight of the pod was 172.49 g where six genotypes exceed the general mean. The TGS989-41F, TGX 1989-21F, IARS87-1, AGS376 were statistically at par with each other and significantly superior to remaining other genotypes studied which was found significant at 1% level (Table 2).
Test weight in kg (1000 seeds)
The test weight ranged from 0.096 (AGS371) to 0.27kg (F778817). The general mean for this trait was 0.1536 kg and six genotypes exceeded the general mean. The F778817 was superior to all other genotypes. The G-1873 was statistically at par with TGS1989-41F, KAVRE, PUJA, AGS376, and SBO-122. These genotypes were significantly higher to other remaining genotypes. Similarly, AGS371 was statistically at par with TGS1987-62F and inferior to all other genotypes (Table 2).
Grain yield
The grain yield ranged from 1.12 (TGGS1989-21F) to 2.94 tons/ ha (F778817). The average grain yield was 1.69 tons/ha and six genotypes exceed the general mean. The F778817 was statistically similar to G-1873 and superior to all other genotypes (Table 2).
Table 2: Performance of different soybean genotypes for various morphological traits, 2018.
|
Genotypes |
Characters |
|||||||
|
DF50 |
WP |
TW |
GY |
NT |
NN |
BPH |
IL |
|
|
P194159 |
75.66abcde |
166bc |
0.15bcde |
1.42ef |
27.53ab |
15.46cd |
18.7bcd |
4.37abcd |
|
LS77-16-16 |
68.00e |
91.20c |
0.14cdef |
1.27f |
12.33d |
12.26e |
14.06d |
3.96bcd |
|
IARS87-1 |
74.00bcde |
196.66ab |
0.14cdef |
1.56def |
28.33ab |
16.40bcd |
22.12bcd |
3.67bcd |
|
SB0-122 |
83.33abc |
140bc |
0.15bcdef |
1.29f |
32.86ab |
18.60ab |
25.12bc |
3.69bcd |
|
AGS376 |
76.66abcde |
202ab |
0.17bc |
2.13bcd |
27.53ab |
16.266bcd |
22.94bcd |
3.72bcd |
|
TGX1418-1D |
78.66abcde |
170bc |
0.12efgh |
1.48ef |
31.40ab |
15.60cd |
19.70bcd |
2.88d |
|
F778817 |
72.33cde |
169.33bc |
0.27a |
2.94a |
24.46bc |
16.66bcd |
23.92bcd |
5.11ab |
|
SB0-115 |
76.33abcde |
167.33bc |
0.13defg |
1.73cdef |
30.33ab |
19.86a |
35.91a |
4.92ab |
|
AGS371 |
76.00abcde |
114.66bc |
0.096h |
1.20f |
23.80bc |
16.86bcd |
15.34cd |
4.05bcd |
|
G-1873 |
69.33de |
181.33bc |
0.18b |
2.49ab |
16.20cd |
15.53cd |
25.55bc |
5.55a |
|
TGS1989-41F |
84.00abc |
280a |
0.15bcdef |
1.12f |
33.13ab |
17.66abc |
22.68bcd |
4.58abc |
|
TGS1990-4904L |
80.33abcd |
179.33bc |
0.11fgh |
1.48ef |
29.33ab |
16.60bcd |
27.58ab |
3.07cd |
|
TGX1989-21F |
85.66ab |
273.33a |
0.13efgh |
1.45ef |
26.40ab |
19.86a |
23.98bcd |
3.75bcd |
|
TGX1987-62F |
87.60a |
167.33bc |
0.10gh |
1.98bcde |
33.46ab |
14.46de |
19.44bcd |
2.94d |
|
KAVRE |
86.66a |
134.66bc |
0.17bcd |
2.18bc |
35.73a |
20.13a |
23.50bcd |
4.06bcd |
|
PUJA |
69.33de |
126bc |
0.17bc |
1.38ef |
32.93ab |
16.33bcd |
22.10bcd |
4.37abcd |
|
CV (%) |
8.06 |
27.33 |
13.34 |
19.64 |
19.20 |
8.11 |
24.59 |
19.07 |
|
EMSS |
39.32 |
2224 |
0.03 |
0.11 |
28.63 |
1.854 |
31.08 |
0.59 |
|
LSD0.05 |
10.45 |
78.63 |
0.03 |
0.55 |
8.92 |
2.27 |
9.29 |
1.28 |
|
Grand Mean |
77.75 |
172.49 |
0.15 |
1.69 |
27.86 |
16.7875 |
22.66 |
4.04 |
|
TOS |
** |
** |
** |
** |
** |
** |
* |
* |
Note: DF50: Days to 50% flowering; WP: Fresh weight of pods; TW: Test weight; GY: Grain yield; NT: Number of trifoliate; NN: Number of nodes; BPH: basal pod height; IL: Internodal length; PH: Plant height; NB: Number of branches; NP: Number of pods; NG: Number of grains; PLM: Pod length at maturity; LA: Leaf Area; DM: Days to maturity; Vg: Genotypic variance; Ve: Environmental variance; Vp: Phenotypic variance; GCV: Genotypic coefficient of variation; PCV: Phenotypic coefficient of variance; BSH: Broad sense heritability; GA: Genetic advance; GA%: Genetic advance as percent of mean.
Number of trifoliate
The number of trifoliate ranged from 35.7 (KAVRE) to 12.33 (LS77-16-16). The average number of trifoliate was 27.86 and ten genotypes exceed the general mean. KAVRE was superior to F778817, AGS371, G-1873, LS77-16-16 but statistically, at par with remaining other genotypes Similarly, LS77-16-16 was at par with G-1873 and was inferior to all other genotypes (Table 2).
Number of nodes
The number of nodes ranged from 12.33 (LS77-16-16) to 20.13 (KAVRE). The general mean for this trait was 16.78 and five genotypes exceed the general mean. The SBO-115, TGX1987-62F, KAVRE, SBO-122 were statistically at par with each other and superior to other genotypes studied. LS77-16-16 was statistically at par with TGX1987-62F and was inferior to all other genotypes (Table 2).
Basal pod height (cm)
The basal pod height ranged from to 14.06 (LS77-16-16) to 35.91cm (SB0-115). The general mean of the genotypes was 22.66cm and eight genotypes exceeded the general mean. The SBO-115 was statistically similar to TGX1990-4904L and was superior to all other genotypes. Likewise, G-1873, SB0-122 and TGX1990-4904L was statistically at par with each other and inferior to SBO-115 but were superior to other remaining genotypes for this trait (Table 2).
Internodal length (cm)
The internodal length ranged from 2.8 (TGX1418-1D) to 5.55cm (G-1873). The average internodal length was 4.04 cm and seven genotypes exceeded the general mean. The G-1873 was statistically at par with P194159, F778817, SBO-115, G-1873, PUJA and superior among remaining genotypes. TGX1418-1D and TGX1987-62F were statistically at par with each other and other genotypes. Similarly, the genotypes such as F778817, SB0-115 and TGS1989-41F were inferior at 5% level of significance (Table 2).
Plant height (cm)
The plant height ranged from 119.68 (KAVRE) to 60.36 cm (LS77-16-16). The average plant height was 84.98 cm and five genotypes exceeded the general mean. KAVRE was statistically at par with SBO-115 and was superior to other remaining genotypes. Similarly, the LS77-16-16 was statistically at par with P194159, SBO -122, TGX1418-1D, and TGX1987-62F and was inferior to other genotypes at 1% level of significance (Table 3).
Number of branches
The number of branches ranged from 6.6 (PUJA) to 12 (TGX1418-1D). The average number of branches was 9.06 and nine genotypes exceeded the general mean. The TGX1418-1D was statistically at par with AGS371, G-1873, TGS1989-41F, KAVRE, and IARS87-1 and was significantly superior to remaining genotypes. Likewise, PUJA was significantly at par with P194159, LS-77-16-16, SBO-122, TGX1418-1D, SB0-115, TGX1989-21F and inferior to all other genotypes at 1% level of significance (Table 3).
Number of pods
The number of pods ranged from 46.46 (LS77-16-16) to 93.8 (TGX1990-4904L). The average number of pods was 63.95 and seven genotypes exceeded the general mean. The TGX1990-4904L was statistically at par with SBO-115, AGS371, TGX1987-62 and was superior to all other genotypes studied. The LS77-16-16 was inferior to SBO-115, AGS371, TGX1990-4904L, KAVRE for this trait and statistically at par with other remaining genotypes (Table 3).
Number of grains
The number of grains ranged from 71.8 (PUJA) to 148.2 (TGX1987-62F). The average number of grains was 111.45 and seven genotypes exceeded the general mean. The TGX1987-62F was significantly superior from P194159, LS77-16-16, IRS87-1, and SB0-122 and was statistically at par with all other genotypes. PUJA was inferior to AGS376, SB0-115, AGS371, TGX1990-4904L, TGX1989-21F, TGX1987-62F and was significantly at par with remaining genotypes at 5% level of significance (Table 3).
Pod length
The value of the pod length ranged from 4.51 (PUJA) to 3.17 (TGX1989-62F). The average pod length was 3.95cm and twelve genotypes exceeded the general mean. The P194159, IARS87-1, AGS7376, F778817, PUJA, LS77-16-16 were statistically at par with each other and superior to other remaining genotypes while TGX1989-21F was statistically at par with TGX1990-4904L, TGX1987-62F and KAVRE and inferior to other genotypes (Table 3).
Leaf area
The leaf area ranged from 38.24 (IARS87-1) to 78.7 cm2 (SBO-115). The average leaf area was 55.28 cm2 and seven genotypes exceeded the general mean. Genotype SB0-115 was statistically at par with G-1873, TGS1989-41F, TGX1990-4904L and, KAVRE and was superior to remaining genotypes studied. Similarly, IARS87-1 and TGX1418-1D were statistically inferior to SBO-115, G-1873, TGS1989-41F, TGX1989-21F, KAVRE and were statistically at par with remaining all other genotypes (Table 3).
Days to maturity
The days to maturity ranged from 119.33 (LS77-16-16) to 146.66 days (TGX1990-4904L). The average days to maturity were 133.83 days and eight genotypes exceeded the general mean. The TGX1990-4904L was statistically at par with SB0-122, SB0-115, GS1989-41F, TGX1989-21F indicating late maturing genotypes among all other genotypes studied whereas LS77-16-16 was statistically at par with IARS87-1, G-1873, PUJA which include the group of early maturing genotypes (Table 3).
Correlation between grain yield and other traits
The phenotypic correlation coefficients among yield and yield components are presented. The results showed that the test weight showed a significant positive correlation (0.708**) to grain yield (Table 4). Similarly, the number of nodes (0.025), basal pod height (0.277), internodal length (0.403), plant height (0.26), number of branches (0.042), number of grains (0.178), pod length at maturity (0.101) and leaf area (0.083) showed a positive correlation with grain yield. Dayaman (2007) reported the non-significant negative correlation of the number of branches per plant (-0.003) with the yield. Baig et al. (2017) reported that the number of branches (0.016) showed positive but non-significant relation with the yield per plant which is similar to our findings. Likewise, Bisinotto et al. (2017) reported a positive and significant correlation of test weight with grain yield (0.70**) which is in line with the findings of our study. The days to 50 % flowering (-0.137) number of trifoliate (-0.145), the number of pods (-0.101) and days to maturity (-0.215) showed a negative correlation with grain yield (tons ha-1) (Table 4). Aondover et al. (2013) reported the negative correlation between days to 50% flowering and seed yield (-0.124) which is similar to the findings of this study. Sulistyo et al. (2018) illustrated the negative correlation between days to maturity and yield (-0.101) which is similar to the findings of this study.
Correlation among character
The days to 50% flowering were positively significant to the number of trifoliate (0.678) and days to maturity (0.766) at 1% level of significance. Similarly, it was found positively significant to the number of nodes (0.524) at 5% level of significance. Likewise, it showed a positive correlation to fresh weight of pod, basal pod height, plant height, number of branches, number of pods, number of grains and leaf area. But, it showed negative significant correlation to pod length at maturity (-0.652) at 1% level of significance. Similarly, it showed a negative correlation with test weight, grain yield and internodal length (Table 4). Aondover et al. (2013) found a similar result of days to 50% flowering having a positive correlation with plant height (0.477).
The fresh weight of pod showed a negative correlation to grain yield and pod length at maturity whereas it showed a positive correlation to remaining traits (Table 4).
The test weight was positively significant to grain yield (0.708) and internodal length (0.623) at 1% level of significance. Likewise, it showed a positive correlation with pod length (0.547) at 5% level of significance. But, it showed a negative correlation to the number of trifoliate, plant height, number of branches, number of pods, number of grains, leaf area and days to maturity (Table 4). Similarly, Bisinotto et al. (2017) reported similar findings of test weight positively correlated with basal pod height (0.19) and the number of nodes (0.16). Balla and Ibrahim (2017) also found the negative correlation of test weight with days to maturity (-0.363) and the number of pods (0.278) whereas reported the positive correlation of test weight with plant height (0.08). Iqbal et al. (2010) showed the significant negative correlation between test weight and the number of branches (-0.21*) which slightly matches with our findings. Likewise, Iqbal et al. (2010) showed the negative and non-significant relation between days to maturity and test yield (-0.02).
The number of trifoliate showed a significant positive correlation to the number of nodes and days to maturity at 5% level of significance. It showed the negative correlation to internodal length and pod length at maturity whereas it showed the positive correlation to other remaining traits (Table 4).
Table 3: Comparison of different soybean genotypes for various traits, 2018.
|
Genotypes |
Characters |
||||||
|
PH |
NB |
NP |
NG |
PLM |
LA |
DM |
|
|
P194159 |
75.07efg |
8.06cdef |
59.86bcde |
83.93de |
4.52a |
50.33cdef |
128.33c |
|
LS77-16-16 |
60.36g |
6.93ef |
46.46e |
93.33cde |
4.27ab |
43.52ef |
119.33d |
|
IARS87-1 |
79.81ef |
10.33abc |
66.66bcde |
103.00bcde |
4.47a |
38.24f |
127cd |
|
SB0-122 |
65.36fg |
7.40def |
50.66de |
100.06bcde |
3.72cd |
47.70def |
138.66ab |
|
AGS376 |
78.18ef |
9.33bcd |
61.46bcde |
121.66abcd |
4.61a |
46.53def |
129.33c |
|
TGX1418-1D |
76.15efg |
12.00a |
64bcde |
110.66abcde |
4bc |
38.96f |
129c |
|
F778817 |
79.98ef |
7.33def |
60.20bcde |
112.86abcde |
4.57a |
41.68ef |
128.66c |
|
SB0-115 |
115.04ab |
8.33cdef |
80.33ab |
120.66abcd |
3.71cd |
78.71a |
140.66ab |
|
AGS371 |
80.23ef |
10.40abc |
71.86abcd |
142.93ab |
3.73cd |
52.18cdef |
137.66b |
|
G-1873 |
81.70def |
11.33ab |
52.66cde |
107.43abcde |
3.67cd |
76.42ab |
127.33cd |
|
TGS1989-41F |
102.93bc |
10.26abc |
63.80bcde |
98.26bcde |
3.99bc |
71.59abc |
143.66ab |
|
TGS1990-4904L |
97.32cd |
9.06bcde |
93.80a |
130.46abc |
3.46de |
63.87abcde |
146.66a |
|
TGX1989-21F |
91.77cde |
9.13bcde |
69.66bcde |
131.46abc |
3.17e |
56.15bcdef |
141.66ab |
|
TGX1987-62F |
75.50efg |
8.26cdef |
76.13abc |
148.20a |
3.36de |
54.89bcdef |
138b |
|
KAVRE |
119.68a |
10.20abc |
54.20cde |
106.56abcde |
3.53cde |
68.20abcd |
138b |
|
PUJA |
80.65ef |
6.60f |
51.46de |
71.80e |
4.51a |
55.48bcdef |
127.33cd |
|
EMSS |
81 |
1.438 |
154.3 |
520.9 |
0.07 |
140 |
20.41 |
|
CV (%) |
10.58 |
13.23 |
19.42 |
20.47 |
6.69 |
21.40 |
3.37 |
|
LSD |
15.00 |
1.99 |
20.71 |
38.05 |
0.44 |
19.73 |
7.53 |
|
Grand Mean |
84.98 |
9.06 |
63.95 |
111.45 |
3.95 |
55.28 |
133.83 |
|
TOS |
** |
** |
** |
* |
** |
** |
** |
Note: DF50: Days to 50% flowering; WP: Fresh weight of pods; TW: Test weight; NT: Number of trifoliate; NN: Number of nodes; BPH: Basal plant heright; IL: Internodal length; PH: Plant height; NB: Number of branches; NP: Number of pods; NG: Number of grains; PLM: Plant length at maturity; LA: Leaf area; DM: Days to maturity; CV: Coefficient of variance; LSD: Least significant difference; TOS: Test of significance; EMSS: Error mean sum of square; *: significance at 0.05 level; **: significance at 0.01 level.
Table 4: Correlation analysis among various yield characters of different soybean genotypes in Regional Agriculture Research Station (RARS), Lumle, Nepal, 2018.
The number of nodes showed a significant positive correlation to basal pod height, plant height, days to maturity at 1% level of significance. It showed a positive correlation to leaf area, number of grains, number of pods, number of branches and internodal length. Similarly, it showed a negative correlation to pod length at maturity (Table 4). Bisinotto et al. (2017) also found that the number of nodes showed a significant positive correlation with basal pod height (0.42*) and days to maturity (0.41*).
The basal pod height showed a significant positive correlation to plant height at 1% level of significance and to leaf area at 5% level of significance. Similarly, it showed a negative correlation to the number of branches and pod length at maturity. It remained positively correlated with the remaining traits. The internodal length was negatively correlated to branches number, pods number, grain number and days to maturity. It showed positive correlation to plant height, pod length and leaf area (Table 4). Aondover et al. (2013) showed a significant negative correlation of basal pod height with the number of branches (-0.566*). Balla and Ibrahim (2017) also reported a highly significant positive correlation with plant height (0.819**).
The plant height showed a significant positive correlation to leaf area and days to maturity at 1% level. Baig et al. (2017) reported similar results of highly significant positive correlation of plant height with days to maturity (0.561**). Sulistyo et al. (2018) reported that the number of pods has a positive correlation with plant height (0.076). It showed negative correlation to pod length and positive correlation to the number of pods, grain number and number of branches (Table 4). Chavan et al. (2016) also have found that plant height has a negative correlation with grain number (-0.1532). Iqbal et al. (2010) also reported that plant height has a positive correlation with the number of grains (0.15). Balla and Ibrahim (2017) mentioned the positive correlation of plant height with the number of pods (0.278).
The number of branches was negatively correlated to pod length and positively correlated to the number of pods, the number of grains. Chavan et al. (2016) also reported a positive positive correlation of the number of branches with the number of grains (0.02), leaf area and days to maturity. Also, the number of pods showed a significant positive correlation to the number of grains and days to maturity. Baig et al. (2017) reported a highly significant positive correlation of the number of pods with days to maturity (0.480**). Similarly, Sulistyo et al. (2018) also found a highly significant positive correlation of the number of pods with days to maturity (0.653***) at 1% level. It showed a positive correlation to leaf area and negative correlation to pod length (Table 4).
The number of grains showed a positive correlation to days to maturity and negative correlation to pod length at 5% level of significance. The pod length at maturity showed negative significant correlation to days to maturity and leaf area at 1% and 5% level respectively. Similarly, leaf area was significantly correlated with days to maturity at 5% level (Table 4).
Path analysis
The path coefficient analysis of different traits affecting yield directly or indirectly found that the highest positive direct effect was contributed by internodal length (2.635) followed by basal pod height (1.36), number of grains (1.359), number of trifoliate (1.146), days to 50% flowering (0.149, number of branches (0.057). Similarly, days to maturity (-1.894) has the highest negative direct effect on yield. Leaf area (-1.653), test weight (-1.019), plant height (-0.896), number of pods (-0.596), number of nodes (-0.323), pod length at maturity (-0.351), fresh weight of pods (-0.140) had negative direct effect on grain yield (Table 5). Jain et al. (2015) have reported a direct positive effect of the number of grains (0.227) and the number of branches (0.275) and showed negative effects of plant height (-0.143) on the yield which aligns with this result. Similarly, Baig et al. (2017) have found a positive direct effect of days to 50% flowering on grain yield (0.4650) as well reported that plant height (-0.092) and the number of pods (-0.1158) have a negative direct effect on grain yield which is similar to our findings. Likewise, Thakur et al. (2015) represented the negative direct effect of days to maturity (-0.104) and plant height (-0.199) on grain yield which provides positive evidence to our findings.
Though test weight showed a highly significant correlation with grain yield it has a negative direct effect on grain yield. The negative direct effect of test weight was nullified by the positive indirect effect of test weight via internodal length, the number of pods, basal pod height, days to maturity, leaf area and plant height. Test weight showed the highest positive indirect effect via internodal length on grain yield (Table 5). Balla and Ibrahim (2017) also reported a negative direct effect of test weight on grain yield (-0.912).
Genotypic variance
Fresh weight of pod (1793) showed highest genetic variability followed by plant height (242), number of grains (238.93), leaf area (123.43), number of pods (102.43), days to maturity (52.14) and days to 50% flowering (27.49), number of trifoliate (30.49), test weight (15.51), basal pod height (15.11). Low genetic variability was recorded for length of the pod (0.21), internodal length (0.38), number of branches (2.09), number of nodes (3.75) (Table 6).
Genotypic and phenotypic coefficient of variance
High genotypic coefficient of variance (GCV) and phenotypic coefficient of variance (PCV) was recorded for the fresh weight of pods, test weight and grain yield and leaf area. Baraskar et al. (2014) found similar results for test weight with (22.55% and 10.28% PCV and GCV respectively) as well as for grain yield with (27.74% and 19.07 % PCV and GCV respectively. It indicates the presence of sufficient inherent genetic variance over which selection can be effective. High PCV and moderate GCV were recorded for the number of trifoliate, basal pod height, internodal length, plant height, number of branches, number of pods and number of grains. Similarly, moderate GCV and PCV were recorded for pod length which suggests sufficient variability and can have some scope for selection. The low GCV and moderate PCV was observed for days to 50% flowering while low GCV and PCV were recorded for days to maturity (Table 6). Bisinotto et al. (2017) recorded high PCV and moderate GCV for plant height, number of branches and number of pods while it recorded the low GCV and PCV for days to maturity which is in line with our results.
Heritability
Heritability estimates ranged from 79% for test weight to 31% for the number of grains. Heritability was found to be highest for test weight (0.79) followed by plant height (0.75), pod length (0.75), days to maturity (0.72) grain yield (0.67), and the number of nodes (0.66). Baraskar et al. (2014) reported similar results for grain yield with the heritability of 47.30%. The moderate heritability was found in a trait like the number of branches (0.59), number of trifoliate (0.52), leaf area (0.47), fresh weight of pods (0.45), days to 50% flowering (0.41), number of pods (0.40), internodal length (0.39), basal pod height (0.33) and number of grains (0.31). Baraskar et al. (2014) found similar results in the number of grains with a heritability of 24.20%. High values of broad-sense heritability indicate that the characters are less influenced by environmental effects (Table 6). Desissa (2017) found the high genetic heritability for plant height (84.59%) and days to maturity (91.48%) while the moderate heritability was estimated for leaf area (46.34%) and days to 50% flowering (58.75%) which is similar to our findings.
Genetic advance and genetic advance as a percentage of mean
High genetic advance as a percentage of mean was recorded for the fresh weight of pod, test weight, grain yield, plant height, pod length, basal pod height, number of branches, number of pods, number of trifoliate and leaf area. The moderate genetic advance as percent of mean was recorded for the number of nodes, internodal length, number of grains. Likewise, low genetic advance as percent of mean was recorded for days to 50% flowering and days to maturity (Table 6). Desissa (2017) reported the high genetic advance as a percentage of the mean for plant height (21.3) and pod length (35.3), medium for the number of pods per plant (11.4) and low for days to maturity (9.96) which aligns with the findings. Dilnesaw et al. (2013) reported the high genetic advance for grain yield, plant height and the number of branches which is in line with this study. Similarly, Aditya et al. (2011) estimated the high genetic advance as a percentage of the mean for the plant height (23.30) which is similar to the findings of this study.
High heritability for test weight, grain yield, plant height and pod length were associated with high genetic advance. Similarly, moderate genetic heritability with high genetic advance was found in traits like the fresh weight of pods, basal pod height, number of branches, number of trifoliate, number of pods and leaf area. The high to moderate genetic control with high genetic advance indicates that there is additive genetic control in the inheritance of these characters. Therefore, the high genetic gain can be expected from the selection in such a situation (Sharma et al., 1983). The moderate heritability and high genetic advance are noted to indicate additive gene effect (Jain and Ramgiry, 2000; Jagtap and Mehetre, 1994; Ghatge and Kadu, 1993; Rasaily et al., 1986; Zhu, 1992; Rao et al., 1998). High heritability and the low genetic advance was observed for days to maturity reported in Chandrwat et al. (2017) and Baraskar et al. (2014) explained that the presence of non-additive gene action and selection is not rewarded for this trait. Recombination breeding and recurrent selection may be used for such type of traits for population improvement. For most of the characters, where low heritability and the genetic advance was observed, there is a need to build broad-based germplasm through collection and acquisition (Iqbal et al., 2010). The medium heritability and low genetic advance were observed for days to 50 % flowering thus indicating the involvement of non-additive genes. Thus, the observed high to moderate heritability in days to maturity and days to 50% flowering respectively is mainly due to environmental effects. Hence, heterosis breeding involving population improvement exercise may be useful for improvement of these kinds of characters.
Cluster analysis
The cluster analysis was done using all the fifteen morphological traits by grouping the sixteen genotypes into four major groups. It was also found that, among the five clusters, cluster I was the largest and consisted of eight genotypes (P194159, AGS376, TGX1418-1D, G-1873, IARS87-1, AGS371, , F778817, TGX1990-4904L) and clusters II consists of four genotypes (IS77-16-16, SB0-122, PUJA, KAVRE). The smallest group were cluster III (SBO-114 and TGX1987-62) and clusters IV (TG1989-41F and TGX1989-21F) containing two genotypes each (Table 7).
Among the four clusters, cluster IV had the highest average means for maximum traits i.e. nine traits followed by cluster I which had highest average means for four traits whereas cluster III had lowest average means for more number of traits i.e. seven traits followed by cluster II with the lowest average mean for five traits. Cluster I had the highest value for test weight (0.166 kg), grain yield (1.9 tons/ha), basal pod height (24.5cm) and pod length (4.13cm), Similarly, it had lowest average means for two traits i.e. days to 50% flowering (75.41 days) and number of trifoliate (26.89) whereas Cluster II had the lowest average for the fresh weight of pod (122.96g), number of branches (7.7), number of grains (92.942), plant height (81.51cm) and days to maturity (130.833). Cluster III had the lowest average for test weight (0.1kg), the number of nodes (15.66), basal pod height (17.3), internodal length (3.4 cm), length of pods (3.55 cm), leaf area (53.53 cm2) whereas Cluster IV had lowest average means for only one trait i.e. grain yield (1.2 tons/ha).
Table 5: Path analysis of different traits affecting the yield of different soybean genotypes in RARS, Lumle, Nepal, 2018.
Table 6: Estimation of genetic parameters for different soybean genotypes in RARS, Lumle, Nepal, 2018.
|
Traits |
Vg |
Ve |
Vp |
GCV |
PCV |
BSH |
GA |
GA% |
|
DF50 |
27.49 |
39.32 |
66.81 |
6.74 |
10.51 |
0.41 |
6.93 |
8.91 |
|
WP |
1793.00 |
2224.00 |
4017.00 |
24.55 |
36.74 |
0.45 |
58.28 |
33.79 |
|
TW |
0.001551 |
0.00042 |
0.0019771 |
25.64 |
28.90 |
0.79 |
0.07 |
46.85 |
|
GY |
0.23 |
0.11 |
0.34 |
28.07 |
34.26 |
0.67 |
0.80 |
47.38 |
|
NT |
30.49 |
28.63 |
59.12 |
19.82 |
27.60 |
0.52 |
8.17 |
29.32 |
|
NN |
3.75 |
1.85 |
5.60 |
11.53 |
14.10 |
0.67 |
3.26 |
19.42 |
|
BPH |
15.11 |
31.08 |
46.19 |
17.15 |
29.98 |
0.33 |
4.58 |
20.21 |
|
IL |
0.38 |
0.60 |
0.98 |
15.23 |
24.41 |
0.39 |
0.79 |
19.57 |
|
PH |
242.00 |
81.00 |
323.00 |
18.30 |
21.15 |
0.75 |
27.74 |
32.64 |
|
NB |
2.09 |
1.44 |
3.53 |
15.95 |
20.72 |
0.59 |
2.29 |
25.28 |
|
NP |
102.43 |
154.30 |
256.73 |
15.83 |
25.05 |
0.40 |
13.17 |
20.59 |
|
NG |
238.93 |
520.90 |
759.83 |
13.87 |
24.73 |
0.31 |
17.86 |
16.02 |
|
PLM |
0.21 |
0.07 |
0.28 |
11.46 |
13.27 |
0.75 |
0.81 |
20.39 |
|
LA |
123.43 |
140.00 |
263.43 |
20.10 |
29.36 |
0.47 |
15.67 |
28.34 |
|
DM |
52.14 |
20.41 |
72.55 |
5.40 |
6.36 |
0.72 |
12.61 |
9.42 |
Note: DF50: Days to 50% flowering; WP: Fresh weight of pods; TW: Test weight; GY: Grain yield; NT: Number of trifoliate; NN: Number of nodes; BPH: basal pod height; IL: Internodal length; PH: Plant height; NB: Number of branches; NP: Number of pods; NG: Number of grains; PLM: Pod length at maturity; LA: Leaf Area; DM: Days to maturity; Vg: Genotypic variance; Ve: Environmental variance; Vp: Phenotypic variance; GCV: Genotypic coefficient of variation; PCV: Phenotypic coefficient of variance; BSH: Broad sense heritability; GA: Genetic advance; GA%: Genetic advance as percent of.
Table 7: Grouping of sixteen soybean genotypes under four clusters based on agro-morphological traits, 2018.
|
S. No. |
Cluster number |
Number of genotype |
Genotypes |
|
1. |
Cluster I |
8 |
P194159, AGS376, TGX1418-1D, G1873, IARS87-1, AGS371, F778817, TGX1990-4904L |
|
2. |
Cluster II |
4 |
IS77-16-16, SB0-122, PUJA, KAVRE |
|
3. |
Cluster III |
2 |
SBO-115 and TGX1987-62 |
|
4. |
Cluster IV |
2 |
TG1989-41F and TGX1989-21F |
The highest cluster centroids distance was found to be in between cluster II and cluster IV (157.901) followed by cluster III and cluster IV (141.303), cluster I and cluster IV (99.191), cluster I and cluster II (61.657), cluster II and cluster III (61.184) and finally cluster I and cluster III (53.416) (Table 8).
Table 8: Inter-cluster distances of different characters in soybean genotypes, 2018.
|
Cluster I |
Cluster II |
Cluster III |
Cluster IV |
|
|
Cluster I |
0.00000 |
|||
|
Cluster II |
61.6567 |
0.00000 |
||
|
Cluster III |
53.4160 |
61.1840 |
0.00000 |
|
|
Cluster IV |
99.9194 |
157.901 |
141.303 |
0.00000 |
Among four different clusters, cluster IV (79.95%) had the highest similarity level followed by cluster III (72.11%), cluster I (65.89%) and cluster II (56.21%). Thus, the ultimate similarity among all clusters is 0% (Figure 1).
The results revealed that there is enough genetic variability between genotypes which distinctly differentiates them into four clusters. Genotypes within the same cluster are genetically more similar. Cluster analysis helps to avoid selection of parents from genetically homogenous clusters. The inter-cluster distance between cluster II and cluster IV was the highest which showed that there is wide genetic diversity. Hence, the selections of genotypes from the two clusters with wider inter-cluster distance for hybridization could be effective.
Conclusions and Recommendations
The findings of this study helped to conclude that there is sufficient genetic variability among genotypes and utilization of this variability can be made for selection and improvement. F778817, G-1873 and KAVRE were high yielding. The phenotypic coefficient of variance was higher than genotypic coefficient of variance for all traits studied. The high estimates of genotypic variance and phenotypic variance were identified for the fresh weight of pods, test weight, grain yield, leaf area which indicates that selection could be effective based on these characters and their phenotypic expression would be a good indication of the genotypic potential.
The path analysis revealed that though test weight had significant positive correlation it had a negative direct effect which implies that selection based on this trait should be avoided. The internodal length had the highest direct positive effect, so direct selection for this trait can be done and days to maturity had the highest direct negative effect. The results of the cluster analysis showed that there were four clusters of sixteen genotypes and showed high genetic divergence. The cluster II and cluster IV had the highest inter-cluster distance and selection of genotypes from these two clusters could be effective in breeding for hybridization.
Acknowledgements
The authors are grateful to every helpful mind and supporting hands involved in this research.
Novelty Statement
This is novel research to identify promising genotypes for mid-hills of Nepal i.e. F778817, G-1873 and KAVRE in terms of yield. The path analysis revealed that though test weight had significant positive correlation it had a negative direct effect which implies that selection based on this trait should be avoided. The genotypes from cluster II and cluster IV could be effective for hybridization in plant breeding. The traits like the fresh weight of pods, test weight, grain yield, leaf area with higher GCV and PCV denotes that selection could be effective based on these above-mentioned characters. Similarly, their phenotypic expression would be a good indication of the genotypic potential.
Author’s Contribution
Anjali Khadka: She was involved in the overall process ranging from research design, on-farm activities, data collection, data analysis, interpretation of data, drafting of the manuscript to final publication.
Subodh Raj Pandey: He was involved in the overall process ranging from research design, on-farm activities, data collection, data analysis, interpretation of data, drafting of the manuscript to final publication.
Subarna Sharma Acharya: Major supervisor, facilitated throughout the research.
Amrit Poudel: Minor supervisor, facilitated throughout the research.
Sushma Adhikari: She was involved in on-farm activities, data collection, preparation of manuscript to final publication.
Conflict of interest
The authors have declared no conflict of interest.
References
Aditya, J.P., P. Bhartiya and A. Bhartiya. 2011. Genetic variability, heritability and character association for yield and component characters in soybean (G. max (L.) Merrill). J. Central Eur. Agric., 12(1): 27-34. https://doi.org/10.5513/JCEA01/12.1.877
Aondover, S., B.L. Lekan and V. Terkimbi. 2013. Correlation, path coefficient and principal component analysis of seed yield in soybean genotypes. Int. J. Adv. Res., 1(7): 1-5.
Baig, K.S., P.P. Jadhav, D.H. Sarang and K.S. Chandrawat. 2017. Correlation and Path Analysis Studies in Soybean (Glycine max (L.) Merrill.). Int. J. Pure Appl. Biosci., 5(4): 489-492. https://doi.org/10.18782/2320-7051.2679
Balla, M.Y. and S.E. Ibrahim. 2017. Genotypic correlation and path coefficient analysis of soybean [Glycine max (L.) Merr.] for yield and its components. Agric. Res. Tech., 7(3): 1-5.
Baraskar, V.V., V.H. Kachhadia, J.H. Vachhani, H.R. Barad, M.B. Patel and M.S. Darwankar. 2014. Genetic variability, heritability and genetic advance in soybean [Glycine max (L.) Merrill]. Electron. J. Plant Breed., 5(4): 802-806. http://www.ejplantbreeding.org/index.php/EJPB/article/view/297
Bisinotto, F.F., O.T. Hamawaki, A.P.O Nogueira, R.L., Hamawaki, J.S. Glansenapp and C.L. Hamawaki. 2017. Path analysis and traits correlation in soybean. Commun. Plant Sci., 7(12): 27-33. https://doi.org/10.26814/cps2017005
Chandrawat, K.S., K.S. Baig, S. Hashmi, D.H. Sarang, D. Kumar and P.K. Dumai. 2017. Study on genetic variability, heritability and genetic advance in soybean. Int. J. Pure Appl. Sci., 5(1): 51-63. https://doi.org/10.18782/2320-7051.2592
Chaudhary, L.B. and B. Prasad. 1968. Genetic variation and heritability of quantitative characters in Indian mustard (Brassica juncea). Indian J. Agric. Sci., 38: 820-825.
Chavan, B.H., D.V. Dahat, H.J. Rajput, M.P. Deshmukh and S.L. Diwane. 2016. Correlation and path analysis in soybean. Int. Res. J. Multidis. Stud., 2(9): 1-5.
Darai, R., D.B. Gharti and S. Subedi. 2016. Host resistance breeding against the virus diseases of soybean in Nepal. Int. J. Environ. Agric. Res., 2(10): 9-13.
Dayaman, V., 2007. Diversity analysis in soybean [Glycine max (L.) Merrill] using morphological and Simple Sequence Repeat (SSR) markers. Master of science in biotechnology, department of plant molecular biology and biotechnology, center for plant molecular biology. Tamil Nadu Agricultural University, India.
Desissa, D.H., 2017. Genetic variability, heritability and genetic advances of soybean (Glycine max (L.) Merrill) varieties grown at Bako Tibe in Western Ethiopia. Asian J. Plant Sci. Res., 7(5): 20-26.
Dilnesaw, Z., S. Abadi and A. Getahun. 2013. Genetic variability and heritability of soybean (Glycine max (L.) Merrill) genotypes in Pawe district, Metekel zone, Benishangule Gumuz Regional State, North-Western Ethiopia. Wudpecker J. Agric. Res., 2(9): 240–245.
Falconer, D.S. and T.F.C. Mackay. 1996. An introduction to Quantitative Genetics. 4th edition, Prentice Hall, London.
FAOSTAT, 2020. Food and Agriculture Organization of the United Nations (FAO), Rome, Italy. FAOSTAT Database.
Ghatge, R.D. and R.N. Kadu. 1993. Genetic variability and heritability studies in soybean, Adv. Plant Sci., 6(2): 224–228.
Hanson, C.H., H.F. Robinson and R.E. Cornstock. 1956. Biometrical studies of yield in segregating populations of Korean Hespedeza. Agron. J., 48(6): 268-272. https://doi.org/10.2134/agronj1956.00021962004800060008x
IITA, 1992a. Sustainable food production in Sub-Saharan Africa. IITA’s Contributions, International Institute of Tropical Agriculture (IITA), Ibadan, Nigeria.
IITA, 1992b. Soybean for good health, how to grow and use soybean in Nigeria, GLIP. International Institute of Tropical Agriculture (IITA), Ibadan, Nigeria.
IITA, 2000. Annual Report 2000. IITA’s Contributions. International Institute of Tropical Agriculture (IITA), Ibadan, Nigeria.
Iqbal, Z., A. Muhammad, A. Muhammad, R. Neem, M.F. Malik and A. Waheed. 2010. Genetic divergence and correlation studies of soybean [Glycine max (L.) Merrill.] genotypes. Pak. J. Bot., 42(2): 971-976.
Jagtap, D.R. and S.S. Mehetre. 1994. Genetic variability in some quantitative characters of soybean. Ann. Agric. Res., 15(1): 45–52.
Jain, S., S.C. Srivastava, S.K. Singh, Y.M. Indapurkar and B.K. Singh. 2015. Studies on genetic variability, character association and path analysis for yield and its contributing traits in soybean [Glycine max (L.) Merrill]. Legume Res., 38(2): 182-184. https://doi.org/10.5958/0976-0571.2015.00031.4
Jain, P.K. and S.R. Ramgiry. 2000. Genetic variability of metric traits in Indian germplasm of soybean (Glycine max L. Merrill). Adv. Plant Sci., 13(1): 127–131.
Johnson, H.W., H.F. Robinson and R.E. Cornstock. 1955. Estimates of environmental variability in soybeans. Agron. J., 47(4): 314-318. https://doi.org/10.2134/agronj1955.00021962004700070009x
Lush, J.L., 1940. Inter-size correlation regressions of offspring on dam as a method of estimating heritability of characters. Proc. Am. Soc. Anim. Prod., 33: 293-301.
MoALD, 2017. Statistical information on Nepalese agriculture 2073/74 (2016/17). Ministry of Agriculture and Livestock Development (MoALD), Singh Durbar, Kathmandu, Nepal. Government of Nepal.
MoF, 2019. Economic survey 2018/19. Ministry of Finance (MoF), Singh Durbar, Kathmandu, Nepal. Government of Nepal.
Rao, M.S., A.S. Bhagsari and A.I. Mohamed. 1998. Yield, protein and oil quality of soybean genotypes selected for Tofu production. Plant Foods Hum. Nutr., 52(3): 241–251. https://doi.org/10.1023/A:1008032624866
Rasaily, S.K., N.D. Desai and M.U. Kukadia. 1986. Genetic variability in soybean (Glycine max (L.) Merrill), Gujarat Agric. Univ. Res. J., 11(2): 57–60.
Robinson, H.F., R.E. Cornstock and P.H. Harvey. 1949. Estimates of heritability and degree of dominance in corn. Agron. J., 41(8): 353-359. https://doi.org/10.2134/agronj1949.00021962004100080005x
Sharma, S.M., S.K. Rao and U. Goswami. 1983. Genetic variation, correlation and regression analysis and their implications in selection of exotic soybean. Mysore J. Agric. Sci., 17(1): 26- 30.
Sivasubramanjan, S. and M. Menon. 1973. Heterosis and inbreeding depression in rice. Adv. Agron., 47: 85-140.
Sulistyo, A., Purwantoro and K.P. Sari. 2018. Correlation, path analysis and heritability estimation for agronomic traits contribute to yield on soybean. Int. Symp. Food Agro-Biodivers., September 2017, Semarang, Indonesia. 102: 26-27. https://doi.org/10.1088/1755-1315/102/1/012034
Thakur, D.K., S.K. Nag, T.K. Gendley and R.K. Patel. 2015. Character association and path coefficient analysis for seed yield and its contributing traits in soybean [Glycine max (L.) Merrill]. Bioscan, 10(4): 1947-1950. http://www.thebioscan.in/Journal%20Supplement/104(2)Sup09%20DINESH%20KUMAR%20THAKUR.pdf
Weber, C.R. and B.R. Moorthy. 1952. Heritable and non-heritable relationships and variability of oil content and agronomic characters in the F2 generation of soybean crosses. Agron. J., 44(4): 202-209. https://doi.org/10.2134/agronj1952.00021962004400040010x
Zhu, J.C., 1992. Study on the heritability, genetic advance and correlation of primary agronomic traits of spring soybean varieties sown in spring and autumn. Soybean Sci., 11: 322–328.
To share on other social networks, click on any share button. What are these?


