
Heterosis and Inbreeding Depression for Grain Yield Variables in Indigenous Maize Germplasm


Research Article

Heterosis and Inbreeding Depression for Grain Yield Variables in Indigenous Maize Germplasm
Tauseef Taj Kiani1*, Mozammil Hussain1 and Hidayat ur Rahman2
1National Agricultural Research Centre, Islamabad; 2Department of Plant Breeding and Genetics, The University of Agriculture, Peshawar, Pakistan.
Abstract | Heterosis is one of the greatest practical contributions of genetics to the agricultural world and has its most significant expression in maize than other cereal crops. Exploitation of this phenomenon of superior performance of F1 progeny over their parents not only transfigured maize breeding schemes but also constituted the foundation of maize seed industry. Evaluation of per se performance of parental lines and estimation of heterosis and inbreeding depression are prerequisites to start hybrid development program. In this context, we explored heterosis and inbreeding depression in indigenous maize germplasm comprising inbred lines NCMLQ1, NCMLQ2, NCMLD1, NCMLD2, NCMLD3, and NCMLD4. These genotypes were crossed to get ten F1 hybrid combinations, which were used to develop three generations F2, BC1 and BC2. Heterosis (in F1) and inbreeding depression (in F2, BC1 and BC2) were quantified for traits including shelling percentage, kernels per row, kernel rows per ear, and 100-grain weight and grain yield. Non-additive gene action was evident for shelling percentage, kernels per row and 100-grain weight and grain yield for which both heterosis and inbreeding depression were expressed by crosses like NCMLQ2 × NCMLD2 and NCMLQ2 × NCMLD4. The parental lines used in above F1 hybrids could prove useful in exploitation of heterosis and development of hybrids.
Editor | Tahir Sarwar, The University of Agriculture, Peshawar, Pakistan.
Received | February 15, 2015; Accepted | December 08, 2015; Published | December 12, 2015
*Correspondence | Tauseef Taj Kiani, National Agricultural Research Centre, Islamabad, Pakistan; Email | tauseef.kiani@yahoo.com
Citation | Kiani, T. T., M. Hussain and H. Rahman. 2015. Heterosis and inbreeding depression for grain yield variables in indigenous maize germplasm. Sarhad Journal of Agriculture, 31(4): 217-223.
DOI | http://dx.doi.org/10.17582/journal.sja/2015/31.4.217.223
Keywords | Maize, Heterosis, Inbreeding depression, Grain yield, Non-additive gene action
Introduction
Maize is undeniably the most completely domesticated of field crops and since its domestication, purposeful attempts have been made to enhance its yield. Consequently, open-pollinated varieties having distinct characters were developed and can still be seen under cultivation in developing countries. However, the discovery of hybrid vigor or “heterosis” in maize has revolutionized the breeding work being carried out. Exploitation of this phenomena of superior performance of progeny (F1 generally) with respect to their parents not only transfigured maize breeding schemes but also constituted the foundation of maize seed industry (Acquaah, 2007). The hybrid vigor is one of the greatest practical contributions of genetics to the agricultural world and has its most significant expression in maize, as compared to other cereal crops, which is being explored intensively by maize breeders and seed production companies (Paterniani, 2001).
G.H. Shull’s publication in early 1908 “the composition of a field of maize” marked the beginning of the exploitation of heterosis in plant breeding. He reported that inbred lines of maize showed general deterioration in yield and vigor (inbreeding depression), but when crossed, the yield of hybrids exceeded that of the varieties from which the inbreds were derived. Furthermore, they not only had vigor restored greatly but also possessed an increased level of uniformity (Shull, 1908; Crow, 1998).
Shull in 1909 drew the pure-line method in maize breeding proposing the use of continuous selfing to develop homozygous lines that would be of use in hybrid production. This combination of inbreeding and hybridization created the basis of maize improvement and became standard in maize breeding programs (Shull, 1909; Acquaah, 2007). Due to higher yields, uniformity of hybrids, ability to incorporate favourable qualitative traits and be adapted to different habitats, especially length of growing season, the change from open-pollinated to hybrid maize was amazingly rapid (Crow, 1998). The impact of this paradigm shift is clearly evident from global maize yield and production statistics.
Inbreeding depression, however, is the conceptual opposite of heterosis and it is the loss of vigor following related mating. Inbreeding depression is due to reduction in heterozygosity in contrast to heterosis which is often viewed as maximizing heterozygosity (Kaeppler, 2012). The extent of inbreeding depression and homozygosity achieved through self-pollination to develop maize inbred lines and exploitation of heterosis by crossing those lines are two main steps that lead to the development of desired hybrids. In the light of above, the present study aimed at quantifying heterosis and inbreeding depression in indigenous maize germplasm and also to identify parental lines to be used for hybrid development in future maize breeding programs.
Materials and Methods
For heterosis estimates, maize inbred lines NCMLQ1, NCMLQ2, NCMLD1, NCMLD2, NCMLD3, and NCMLD4 were inter crossed to have ten F1 combinations viz:
NCMLQ1 × NCMLQ2 , NCMLQ1 × NCMLD1, NCMLQ1 × NCMLD2, NCMLQ1 × NCMLD3, NCMLQ1 × NCMLD4, NCMLQ2 × NCMLD1, NCMLQ2 × NCMLD2, NCMLQ2 × NCMLD3, NCMLQ2 × NCMLD4, NCMLD3 × NCMLD4. For inbreeding estimates, we developed three generations of each cross viz; F2 (by selfing of F1 plants), BC1 (by backcrossing F1 with parent-1) and BC2 (by backcrossing F1 with parent-2). All six parents with their four generations i.e. F1, F2, BC1 and BC2 were planted in randomized complete block design having three replications following optimum agronomic practices. Data for grain yield and ear traits like shelling percentage, kernels per row, kernel rows per ear, and 100-grain weight were recorded. Thirty guarded plants were used to take data of parents and F1s, 210 plants of F2 and 45 plants of back-crosses. The study was carried out during spring 2009 at National Agricultural Research Centre (NARC), Islamabad, Pakistan
Statistical analysis
Analysis of variance was conducted to check significant differences among generations used for estimation of heterosis and inbreeding depression. Mid-parent (MP) and better parent (BP) heterosis were calculated by using the following formulae (Nadarajan and Gunasekaran, 2008):


Standard errors for both these estimates were calculated as (Nadarajan and Gunasekaran, 2008):

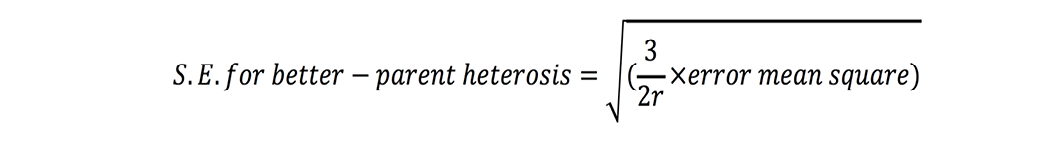
where r is number of replications. t-test was used to check significance of heterosis estimates where ‘t’ values were calculated as (Nadarajan and Gunasekaran, 2008):
Mid-parent heterosis:

Better-parent heterosis:

Estimates were found significant when these tcalc values were greater than ttabulated values at 5% probability.
Inbreeding estimates for each generation were computed as under (Talebi et al., 2010):

Similarly tcalc ßé

These were compared with ttabulated at 5% to determine the significance of inbreeding depression estimates in each of three generations where S.E.M = Standard Dev/no. of observations.
Results and Discussion
Analysis of variance showed significant differences among generations for traits under study viz; shelling percentage, kernels per row, kernel rows per ear and 100-grain weight and grain yield thereby data was pursued for further analysis (Table 1). Mid-parent and better parent heterosis estimates were computed for all traits which sowed varied level of significance corresponding to each cross (Table 2). Inbreeding depression estimates were determined as expressed by three generations F2, BC1 and BC2 of all crosses and results are appended in Table 3. The inconsistent display of inbreeding depression along with the varied expression of heterosis by different crosses gave a hint towards selection of the parental lines for development of hybrids. The point of emphasis here is that the measures of heterosis are phenotype-dependent or, in other words, trait specific. It is therefore, recommended that studies to understand mechanisms of heterosis must be conducted and inferred with respect to specific traits (Kaeppler, 2012). In early 1900s, E. M. East recognized the deleterious effects of inbreeding but was not convinced of the idea of exploitation of heterosis and development of hybrids because the inbred lines were generally very weak, producing little seed and hence the increased cost of seed production negated any increments in yield (Crow, 1998). However, modern day breeders emphasis more on development of parental inbred lines that have greater vigor, greater seed yields and, thus, commercially viable. Hence, our efforts for development of superior inbred lines and exploitation of heterosis for larger commercial gains are more focused now on understanding of underlying genetic make-up of these germplasm resources.
Results of heterosis estimates showed that besides positive heterosis, i.e. heterosis in desired direction, many crosses showed significant negative heterosis over mid-parent and better parent for grain yield, shelling percentage, kernels per row, kernel rows per ear and 100-grain weight. For grain yield, although heterosis was expressed as high as 20.62 percent by hybrid NCMLQ2 × NCMLD2, 15.33 percent by NCMLD3 × NCMLD4 and 10.89 percent by NCMLQ1 × NCMLQ2 over mid-parental values however, remained non-significant statistically. Positive heterosis for this trait have also been reported by Geeta et al. (2001), Bajaj et al. (2007), Amiruzzaman et al. (2011), Ikramullah et al. (2011), Jain and Bharadwaj (2014), whereas Rozende and Souza (2000) reported low heterosis for grain yield.
For shelling percentage, cross combination NCMLQ1 × NCMLD2 expressed significant heterosis over mid-parent (11.09%) and NCMLQ2 × NCMLD4 over both mid-parent (21.30%) and better parent (18.69%). Heterosis for this trait was also found in studies by Ravikant et al. (2006) and Jain and Bharadwaj (2014). For kernels per row, NCMLQ2 × NCMLD2 showed high level of heterosis (13.60%) but remained nonsignificant. On the contrary, studies by Jain and Bharadwaj (2014), Geeta et al. (2001) and Malik et al. (2004) reported heterosis for this character. No hybrid combination displayed positive heterosis for kernel rows per ear in contrast to Jain and Bharadwaj (2014) who reported heterosis for grain rows per cob as did Geeta et al. (2001) and Kara et al. (2001).
However, for 100-grain weight, significant positive heterosis was shown by NCMLQ1 × NCMLD1 over mid-parent (16.42%) and by NCMLQ1 × NCMLD2, NCMLQ2 × NCMLD4 over both mid-parent (40.01%, 37.10%, respectively) and better-parent (17.84%, 35.25%, respectively). Significant heterosis was also found for this trait by Bajaj et al. (2007), Jain and Bharadwaj (2014),, Kara et al. (2001), Dickert and Tracy (2002) and Malik et al. (2004).
It is to be considered here that yield is a complex trait that manifests itself through interaction of the plant with the environment from planting until harvest. Moreover, being quantitative in nature, yield is determined by a large number of genes each individually having a small incremental effect on its total expression. Furthermore, heterosis expressed by hybrids
Table 1: Mean squares for various traits in maize
|
Source of variation
|
d.f.
|
Mean square values |
||||||||||||||
|
Grain yield |
Shelling % |
Kernels per row |
Kernel rows |
100 grain weight |
||||||||||||
|
F2 |
BC1 |
BC2 |
F2 |
BC1 |
BC2 |
F2 |
BC1 |
BC2 |
F2 |
BC1 |
BC2 |
F2 |
BC1 |
BC2 |
||
|
Replications |
2 |
318 |
207 |
139 |
91 |
80 |
89 |
11 |
19 |
32 |
3.57* |
1.70* |
2.0 |
4 |
30 |
21 |
|
Generations |
25 |
277 |
349 |
426 |
62 |
99 |
104 |
188 |
43 |
60 |
1.22* |
1.7 |
1.9 |
25 |
34 |
39 |
|
Error |
50 |
105 |
66 |
66.8 |
17 |
17 |
19.1 |
12 |
9 |
4 |
0.32 |
0.40 |
0.3 |
15 |
19 |
15 |
* Significant at 5%
Table 2: Mid and better parent heterosis estimates for grain yield and other yield attributes in maize
|
Generations |
Grain yield |
Kernel rows per ear |
100 Grain Weight |
|||||||
|
Mean |
MP Hete rosis % |
BP Hete rosis % |
Mean |
MP Hete rosis % |
BP Hete rosis % |
Mean |
MP Hete rosis % |
BP Hete rosis % |
||
|
P A R E N T S |
NCMLQ1 |
68.59 |
|
|
12.71 |
|
|
37.30 |
|
|
|
NCMLQ2 |
64.19 |
|
|
12.67 |
|
|
41.25 |
|
|
|
|
NCMLD1 |
53.18 |
|
|
15.14 |
|
|
39.04 |
|
|
|
|
NCMLD2 |
51.71 |
|
|
13.72 |
|
|
54.59 |
|
|
|
|
NCMLD3 |
51.75 |
|
|
14.84 |
|
|
62.47 |
|
|
|
|
NCMLD4 |
80.91 |
|
|
14.09 |
|
|
40.14 |
|
|
|
|
F1 H Y B R I D S |
Q1 X Q2 |
73.61 |
10.89 |
7.33 |
12.51 |
-1.44 |
-1.58 |
32.02 |
-18.47* |
-22.38* |
|
Q1 X D1 |
62.89 |
3.30 |
-8.30 |
13.66 |
-1.89 |
-9.77* |
44.44 |
16.42* |
13.82 |
|
|
Q1 X D2 |
46.71 |
-22.35 |
-31.9* |
12.69 |
-4.00 |
-7.54* |
64.32 |
40.01* |
17.84* |
|
|
Q1 X D3 |
63.50 |
5.53 |
-7.42 |
13.11 |
-4.84 |
-11.68* |
38.27 |
-23.28* |
-38.74* |
|
|
Q1 X D4 |
74.90 |
0.21 |
-7.42 |
13.10 |
-2.21 |
-7.02* |
35.65 |
-7.91 |
-11.16 |
|
|
Q2 X D1 |
61.29 |
4.44 |
-4.51 |
13.59 |
-2.29 |
-10.25* |
35.46 |
-11.68 |
-14.04 |
|
|
Q2 X D2 |
69.90 |
20.62 |
8.90 |
12.50 |
-5.30 |
-8.92* |
31.72 |
-33.80* |
-41.88* |
|
|
Q2 X D3 |
61.05 |
5.32 |
-4.88 |
13.60 |
-1.15 |
-8.37* |
36.44 |
-29.74* |
-41.68* |
|
|
Q2 X D4 |
49.48 |
-31.79* |
-38.84* |
13.14 |
-1.79 |
-6.74* |
55.79 |
37.10* |
35.25* |
|
|
D3 X D4 |
76.50 |
15.33 |
-5.45 |
12.78 |
-11.69* |
-13.92* |
41.02 |
-20.04* |
-34.33* |
|
*Significant against ttabulated at 5% probability.
Table 3: Inbreeding depression estimates for various traits as manifested in F2, BC1 and BC2 generations
|
Generations |
Grain Yield |
Shelling % |
No of Kernels per Row |
No. of Kernel Rows per ear |
100 Grain Weight |
||||||
|
Means |
ID % |
Means |
ID % |
Means |
ID % |
Means |
ID % |
Means |
ID % |
||
|
PAR EN TS |
NCMLQ1 |
68.59 |
66.98 |
39.92 |
12.71 |
37.30 |
|||||
|
NCMLQ2 |
64.19 |
67.23 |
34.18 |
12.67 |
41.25 |
||||||
|
NCMLD1 |
53.18 |
71.12 |
40.81 |
15.14 |
39.04 |
||||||
|
NCMLD2 |
51.71 |
76.91 |
32.84 |
13.72 |
54.59 |
||||||
|
NCMLD3 |
51.75 |
78.63 |
38.39 |
14.84 |
62.47 |
||||||
|
NCMLD4 |
80.91 |
64.33 |
47.96 |
14.09 |
40.14 |
||||||
|
F1 H YB RI DS |
Q1 X Q2 |
73.61 |
68.28 |
35.63 |
12.51 |
32.02 |
|||||
|
Q1 X D1 |
62.89 |
69.48 |
39.88 |
13.66 |
44.44 |
||||||
|
Q1 X D2 |
46.71 |
79.93 |
35.65 |
12.69 |
64.32 |
||||||
|
Q1 X D3 |
63.50 |
69.91 |
42.74 |
13.11 |
38.27 |
||||||
|
Q1 X D4 |
74.90 |
64.43 |
45.03 |
13.10 |
35.65 |
||||||
|
Q2 X D1 |
61.29 |
67.49 |
38.80 |
13.59 |
35.46 |
||||||
|
Q2 X D2 |
69.90 |
62.84 |
38.07 |
12.50 |
31.72 |
||||||
|
Q2 X D3 |
61.05 |
69.61 |
37.47 |
13.60 |
36.44 |
||||||
|
Q2 X D4 |
49.48 |
79.79 |
37.82 |
13.14 |
55.79 |
||||||
|
D3 X D4 |
76.50 |
65.54 |
47.36 |
12.78 |
41.02 |
||||||
|
F2 GEN ERA TION |
Q1 X Q2 |
49.66 |
32.54* |
69.71 |
-2.10 |
27.55 |
22.66* |
13.20 |
-5.53* |
27.32 |
14.66* |
|
Q1 X D1 |
68.45 |
-8.84* |
66.45 |
4.36* |
26.46 |
33.65* |
12.85 |
5.95* |
25.37 |
42.92* |
|
|
Q1 X D2 |
58.36 |
-24.9* |
72.15 |
9.72* |
25.49 |
28.50* |
13.19 |
-3.98* |
27.38 |
57.43* |
|
|
Q1 X D3 |
56.21 |
11.47* |
72.29 |
-3.40* |
20.30 |
52.49* |
13.63 |
-3.98* |
26.97 |
29.54* |
|
|
Q1 X D4 |
51.65 |
31.05* |
71.00 |
-10.20* |
24.63 |
45.31* |
13.59 |
-3.71* |
27.23 |
23.62* |
|
|
Q2 X D1 |
65.18 |
-6.35 |
69.34 |
-2.74 |
27.34 |
29.53* |
13.29 |
2.22* |
25.52 |
28.02* |
|
|
Q2 X D2 |
49.87 |
28.66* |
68.67 |
-9.28* |
25.32 |
33.48* |
13.22 |
-5.78* |
25.24 |
20.44* |
|
|
Q2 X D3 |
53.35 |
12.62* |
71.03 |
-2.04 |
23.72 |
36.68* |
13.03 |
4.20* |
26.68 |
26.77* |
|
|
Q2 X D4 |
67.49 |
-36.4* |
66.96 |
16.08* |
24.60 |
34.95* |
13.41 |
-2.03* |
26.67 |
52.20* |
|
|
D3 X D4 |
68.99 |
9.82* |
71.97 |
-9.81* |
28.21 |
40.43* |
13.27 |
-3.84* |
27.81 |
32.21* |
|
|
BC1 GEN ERA TIO N |
Q1 X Q2 |
58.21 |
20.92* |
66.31 |
2.89 |
40.41 |
-13.43* |
13.20 |
-5.53* |
29.93 |
6.53* |
|
Q1 X D1 |
54.96 |
12.61* |
61.16 |
11.98* |
41.96 |
-5.23* |
12.75 |
6.70* |
44.17 |
0.61 |
|
|
Q1 X D2 |
45.66 |
2.24 |
69.88 |
12.57* |
35.92 |
-0.77 |
13.22 |
-4.25* |
63.33 |
1.54 |
|
|
Q1 X D3 |
65.30 |
-2.84 |
61.62 |
11.86* |
38.47 |
9.98* |
13.95 |
-6.43* |
40.61 |
-6.12* |
|
|
Q1 X D4 |
79.87 |
-6.64 |
61.98 |
3.79 |
43.99 |
2.30 |
15.18 |
-15.85* |
35.24 |
1.18 |
|
|
Q2 X D1 |
57.95 |
5.44 |
68.99 |
-2.22 |
42.25 |
-8.91* |
13.47 |
0.85* |
36.21 |
-2.13 |
|
|
Q2 X D2 |
73.41 |
-5.02* |
70.05 |
-11.48* |
38.47 |
-1.04 |
13.36 |
-6.91* |
28.42 |
10.41* |
|
|
Q2 X D3 |
67.10 |
-9.91* |
65.87 |
5.38* |
39.65 |
-5.82* |
12.80 |
5.91* |
36.49 |
-0.15 |
|
|
Q2 X D4 |
48.38 |
2.23 |
71.85 |
9.95* |
38.96 |
-3.03* |
13.60 |
-3.48* |
58.87 |
-5.53 |
|
|
D3 X D4 |
78.12 |
-2.12 |
80.70 |
-23.13* |
45.00 |
4.99* |
13.88 |
-8.68* |
38.82 |
5.37* |
|
|
BC2 GEN ER ATI ON |
Q1 X Q2 |
59.27 |
19.49* |
69.67 |
-2.03 |
36.21 |
-1.63 |
12.32 |
1.50* |
30.73 |
4.02 |
|
Q1 X D1 |
54.92 |
12.68* |
65.88 |
5.19* |
34.94 |
12.38* |
12.51 |
8.39* |
45.59 |
-2.59 |
|
|
Q1 X D2 |
46.70 |
0.02 |
79.15 |
0.97 |
36.05 |
-1.13 |
13.71 |
-8.08 |
68.92 |
-7.15* |
|
|
Q1 X D3 |
72.09 |
-13.53* |
70.62 |
-1.01 |
42.50 |
0.55 |
14.87 |
-13.44 |
36.14 |
5.57* |
|
|
Q1 X D4 |
85.80 |
-14.55* |
62.47 |
3.04 |
45.10 |
-0.16 |
14.68 |
-12.06 |
36.53 |
-2.47 |
|
|
Q2 X D1 |
58.53 |
4.51 |
71.47 |
-5.90* |
35.42 |
8.70* |
13.50 |
0.63* |
36.64 |
-3.34* |
|
|
Q2 X D2 |
80.02 |
-14.49* |
82.28 |
-30.94* |
39.73 |
-4.35* |
12.76 |
-2.11 |
27.23 |
14.17* |
|
|
Q2 X D3 |
68.72 |
-12.56* |
64.73 |
7.01* |
39.64 |
-5.79* |
13.45 |
1.11* |
39.84 |
-9.35* |
|
|
Q2 X D4 |
47.30 |
4.41 |
63.38 |
20.56* |
38.96 |
-3.02* |
13.60 |
-3.48 |
64.44 |
-15.50* |
|
|
D3 X D4 |
83.10 |
-8.63* |
72.60 |
-10.76* |
50.04 |
-5.66* |
13.88 |
-8.62 |
40.97 |
0.14 |
|
*Significant against ttabulated at 5% probability.
largely depends on the genetic divergence of the parental lines (Telebi, 2010). Therefore, we can deduce that low values of heterosis for these traits are a consequent of close relatedness of inbred lines used in this study.
Significant positive values of inbreeding depression were found for grain yield in F2 generation of crosses NCMLQ1 × NCMLQ2 (32.54 %), NCMLQ1 × NCMLD3 (11.47%), NCMLQ1 × NCMLD4 (31.05%), NCMLQ2 × NCMLD2 (28.66%), NCMLQ2 × NCMLD3 (12.62%) and NCMLD3 × NCMLD4 (9.82%). Similarly, both backcross generations (BC1 and BC2) of NCMLQ1 × NCMLQ2 and NCMLQ1 × NCMLD1 also expressed significant inbreeding depression for this trait. Similarly, Jain and Bharadwaj (2014) and Ahmad et al. (2010) stated inbreeding depression for grain yield.
The cross NCMLQ2 × NCMLD4 showed maximum significant inbreeding depression (16.08%) in F2 for shelling percentage followed by NCMLQ1 × NCMLD2 (9.72%) and NCMLQ1 × NCMLD1 (4.36%). In addition to these crosses, NCMLQ1 × NCMLD3 (11.86%) and NCMLQ2 × NCMLD3 (5.38%) displayed decreased performance for this trait in BC1, whereas in BC2 , the cross NCMLQ2 × NCMLD4 again expressed highest percentage loss in performance (20.56%) as compared to other crosses. Ravikant et al. (2006) and Jain and Bharadwaj (2014)also reported inbreeding depression for shelling percentage.
All crosses exhibit significant inbreeding depression for kernels per row in F2 ranging from 52.49% by NCMLQ1 × NCMLD3 to 22.66 % by NCMLQ1 × NCMLQ2. Only NCMLQ1 × NCMLD3 (9.98%) and NCMLD3 × NCMLD4 (4.99%) replicated this decline in BC1, NCMLQ1 × NCMLD1 (12.38%) and NCMLQ2 × NCMLD1 (8.70%) in BC2. Inbreeding depression with respect to this trait was also noted in crosses studied by Jain and Bharadwaj (2014)).
Three crosses demonstrated significant inbreeding for no. of kernel rows per ear across all segregating generations under study viz; NCMLQ1 × NCMLD1 (5.95% in F2 , 6.70% in BC1, 8.39% in BC2), NCMLQ2 × NCMLD1 (2.22% in F2 , 0.85% in BC1, 0.63% in BC2 ) and NCMLQ2 × NCMLD3 (4.20% in F2 , 5.91% in BC1, 1.11% in BC2 ). These results are in agreement with those reported by Jain and Bharadwaj (2014) and Ahmad et al. (2010).
Reduction in 100-grain weight was recorded for all crosses in F2. This reduction was apparent in BC1 for only three crosses; NCMLQ1 × NCMLQ2 (6.53%), NCMLQ2 × NCMLD2 (10.41%) and NCMLD3 × NCMLD4 (5.37%). NCMLQ2 × NCMLD2 experienced consistent depression for 100 grain weight having being estimated significantly in BC2 (14.17%) also. Ahmad et al. (2010) and Jain and Bharadwaj (2014) also illustrated inbreeding depression for this plant attribute. Apart from these estimates, significant negative estimates were also demonstrated for crosses in generations studied.
Non-additive gene action can be assumed responsible for the traits when the hybrid combinations exhibit high heterosis followed by a high inbreeding depression in F2 generation (Jain and Bharadwaj (2014)). So it can be inferred that the parents of such crosses possess dominant genes responsible for traits under study, as evident by high heterosis (although non-significant in some cases), followed by high inbreeding depression. This also authenticates our earlier diallel study involving these line where we reported non-additive (dominance) gene action for grain yield, shelling percentage and 100 grain weight (Hussain et al., 2014). This gene action will prove fruitful in exploiting heterosis and developing hybrid cultivars using these particular inbred lines.
However, those hybrid combinations which showed high heterosis coupled with low inbreeding depression could be used to develop superior inbred lines which could be further exploited in hybridization programs. This has also been suggested by Banerjee and Kole (2011) and Jain and Bharadwaj (2014).
Conclusion
As discussed earlier, heterosis should be considered in the context of a specific trait. Furthermore, non-additive gene action becomes evident when a cross expresses high heterosis in F1 and inbreeding depression in F2. This type of gene action is of particular interest for breeders to take advantage of heterosis and develop hybrids. Hence, we also focused our attention under the light of these two factors i.e. trait specific heterosis and non-additive gene action. The crosses NCMLQ2 × NCMLD2 expressed heterosis and inbreeding depression for grain yield and kernels per row. Thus, these parents could be used in hybrid development. On the other hand, cross NCMLQ2 × NCMLD4 demonstrated heterosis and inbreeding depression for shelling percentage and 100-grain weight. Therefore, these parental lines could prove useful in exploitation of heterosis for these traits.
Authors’ Contribution
Tauseef Taj Kiani analysed the data and made a rough draft of the manuscript while Mozammil Hussain conducted research conduct, recorded and compiled data. Hidayat ur Rahman made final draft of the manuscript and reviewed it.
References
- Acquaah, G. 2007. Principles of Plant Genetics and Breeding. Blackwell Publishing, USA.
- Ahmad, M., S. Khan, F. Ahmad, N.H. Shah and N. Akhtar. 2010. Evaluation of 99 S1 lines of maize for inbreeding depression. Pak. J. Agri. Sci. 47(3): 209 – 213.
- Amiruzzaman, M., M.A. Islam, K.V. Pixel and M.M. Rohman. 2011. Heterosis and combining ability of CIMMYT’s tropical × sub-tropical quality protein maize germplasm. Int. J. Sust. Agric. 3(3): 76 – 81.
- Bajaj, M., S.S. Verma, A. Kumar, M.K. Kabdal, J. P. Aditya and A. Narayan. 2007. Combining ability analysis and heterosis estimates in high quality protein maize inbred lines. Indian J. Agric. Res. 41(1): 49 – 53. http://dx.doi.org/10.1080/15427528.2011.521468
- Banerjee, P.P and P.C. Kole. 2011. Heterosis, inbreeding depression and genotypic divergence for some physiological parameters in sesame (Sesamun indicum L.). J. Crop Imp. 25: 11 – 25.
- Crow, J.F. 1998. 90 Years ago: the beginning of hybrid maize. Genetics 148: 923 – 928.
- Dickert, T.E. and W.F. Tracy. 2002. Heterosis for flowering time and agronomic traits among early open pollinated sweet corn cultivars. J. Am. Soc. Hort. Sci. 127(5): 793 – 797.
- Geetha, K. 2001. Heterosis in maize (Zea mays L.). Agric. Sci. Digest (21)3: 202 – 203.
- Ikramullah, I.H. Khalil, M. Noor and M.K.N. Shah. 2011. Heterotic effects for yield and protein content in white quality protein maize. Sarhad J. Agric. 27(3): 403 – 409.
- Jain, R. and D.N. Bharadwaj. 2014. Heterosis and inbreeding depression for grain yield and yield contributing characters in quality protein maize. Agri. Commun. 2(1): 8 – 16.
- Hussain, M., K.N. Shah, A. Ghafoor, T.T. Kiani and T. Mahmood. 2014. Genetic analysis for grain yield and various morphological traits in maize (Zea mays L.) under normal and water stress environments. J. Anim. Plant Sci. 24(4): 1230-1240.
- Kaeppler, S. 2012. Heterosis: many genes, many mechanisms – end the search for an undiscovered unifying theory. ISRN Botany (2012): 1–12. http://dx.doi.org/10.5402/2012/682824
- Kara, S.M. 2001. Evaluation of yield and yield components in inbred maize lines. Heterosis and line × tester analysis of combining ability. Turk. J. Agric. For. 25: 383 – 391.
- Malik, H.N., S.I. Malik, S.R. Chughtai and H.I. Javed. 2004. Estimates of heterosis among temperate, sub-tropical and tropical maize germplasm. Asian J. Plant Sci. 3(1): 6 – 10. http://dx.doi.org/10.3923/ajps.2004.6.10
- Nadarajan, N. and L.M. Gunasekaran. 2008. Quantitative genetics and biometrical techniques in plant breeding. Kalyani publisher, New Dehli, India.
- Paterniani, M.E.A.G.Z. 2001. Use of heterosis in maize breeding: history, methods and perspective – a review. Crop Breed. Appl. Biotechnol. 1(2): 159 – 178. http://dx.doi.org/10.13082/1984-7033.v01n02a07
- Ravikant, R. Prasad and Chandrakant. 2006. Gene effects for metric traits in quality protein maize (QPM) (Zea mays L.). Crop Imp. 33(1): 94 – 101.
- Rozende, G.S.P. and C.L. Souza Jr. 2000. A reciprocal recurrent selection procedure outlined to integrate hybrid breeding programs in maize. J. Genet. Breed. 54: 57 – 66.
- Shull, G.H. 1908. The composition of field maize. Am. Breeders Assoc. Rep. 4: 296-301.
- Shull, G.H. 1909. A pure line method of corn breeding. Am. Breeders Assoc. Rep. 5: 51-59.
- Talebi, E., G. Subramanya and S. Bakkappa. 2010. An investigation on heterosis and inbreeding depression in the silkworm (Bombyx mori L.). J. Agric. Biol. Sci. 5(3): 52-55.
To share on other social networks, click on any share button. What are these?


