
Effect of Non-Farm Income on Poverty and Income Inequality: Farm Households Evidence from Punjab Province Pakistan


Research Article
Effect of Non-Farm Income on Poverty and Income Inequality: Farm Households Evidence from Punjab Province Pakistan
Muhammad Amjed Iqbal1*, Azhar Abbas1, Raza Ullah1, Umar Ijaz Ahmed2, Ali Sher3 and Shoaib Akhtar4
1Institute of Agricultural and Resource Economics, University of Agriculture Faisalabad, Pakistan; 2Muhammad Nawaz Shareef University of Agriculture Multan, Pakistan; 3Nanjing Agriculture University, China; 4College of Economics and Management, Huazhong Agricultural University, Wuhan 430070, Hubei Province, P.R. China.
Abstract | Non-farm income is a major source of income along with farming for agricultural households. The present study is aimed at investigating the significance of non-farm income in farm household’s poverty and income inequality. Data were collected from 480 cotton growing respondents from six districts of Punjab province of Pakistan and Foster, Greer and Thorbecke (FGT) poverty index along with Gini coefficient were estimated to assess the impacts of non-farm income on household’s poverty and income inequality. The results indicated that non-farm income supports towards poverty reduction of households in the study area. However, it was observed that rise in non-farm income has slightly increased the income inequality among the selected households of Punjab Province.
Received | March 21, 2017; Accepted | January 30, 2018; Published | March 15, 2018
*Correspondence | Muhammad Amjed Iqbal, Assistant Professor Institute of Agricultural and Resource Economics, University of Agriculture Faisalabad, Pakistan; Email: amjadiqbal1775@yahoo.com
Citation | Iqbal, M.A., A. Abbas, R. Ullah, U.I. Ahmed, A. Sher and S. Akhtar. 2017. Effect of Non-farm income on poverty and income inequality: farm households evidence from Punjab province Pakistan. Sarhad Journal of Agriculture, 34(2): 233-239.
DOI | http://dx.doi.org/10.17582/journal.sja/2018/34.2.233.239
Keywords | Development, Rural returns, Productivity, Socioeconomic, Poverty index
Introduction
From the last several decades, many developing countries of the world have started to give more consideration to poverty mitigation and it is still the main agenda of many developed and developing economies (Haq et al., 2015). The major issue of many developing countries is to address the poverty in rural areas as many of these countries are basically dependent on agriculture and major portion of their population is resident of rural areas. The main focus of many developing countries is to address rural poverty being widespread in nature as many of these countries primarily rely on agricultural activities that are generally concentrated in rural areas. Nevertheless, it is shown that agricultural income cannot decrease lessen the rural poverty because rural economy is not dependent on agriculture sector only (Csaki and Lerman, 2000). As agriculture has limited capacity to provide income opportunities, majority of poor people in rural areas in many parts of the world Davis and Bazemer (2001), therefore, non-farm activities turn out to be an imperative constituent of livelihood options for rural households. Many studies have ratified the increasing share of non-farm income in total households’ income (Haggblade et al., 2007; Ruben, 2001). The main reasons behind this phenomenon are the decreasing trend in farm incomes, presence of many types of risks in agricultural production and the farmers’ quest to secure farm income against these risks (Ellis and Freeman, 2004). As returns from non-farm income are high and less-risky compared with farming, agricultural households are tempted to opt the non-farm employment.
Poverty is one of the most severe problems of Pakistan. Poverty is termed “as a state of continuous deprivation or lack of basics in life” (Khan et al., 2015). About 21 percent population of the country falls below poverty line as per 2008 population estimates. The poverty line is the lowest level of income required to survive in a particular country. According to the World Bank’s Poverty Head Count Analysis of 2014, the poverty line for Pakistan is taken as $ 1.25 per day per adult. However, using the international standards for middle income countries (USD 2 per day per capita) will increase this percentage and suggest 60.19 percent of the population being poor (GoP, 2014-15). Pakistan’s economy is one of the low income economies with $1250 per capita GDP (Khan et al., 2015). This situation was further intensified due to continuous floods from 2010 to 2014 that added to Pakistan’s economic troubles and threatened to reverse earlier efforts in poverty eradication (IFAD 2012; NDMA 2015).
Poverty is a multidimensional notion. It can be a situation of malnutrition, lack of housing, having disease, lack of access to education and health care services, unemployment and to some extent the lack of liberty. Non-farm income can be helpful to alleviate poverty by targeting many of the above-mentioned dimensions of poverty among agricultural household (De Janvry and Sadoulet, 2001) for making enhancement in the welfare status of households (Barrett et al., 2005; Canagarajah et al., 2001; Ping et al., 2016). In developing countries, the contribution of non-farm income in total income of rural household is almost 30-45 percent (Haggblade et al., 2005). A household survey conducted by Reardon et al., (1998) revealed that the share of non-farm income was almost 42 percent of the households’ total income for Africa, Asia with 32 percent and Latin America with 40 percent. Nevertheless, non-farm income has impact on farm income disparity is diversified and context-specific.
Previous research indicates mixed results regarding income inequality, and non-farm income for rural households. For example, (Adams, 2001; Elbers and Lanjouw, 2001 and Woldehanna, 2002) found that income from sources besides the farming rise sinequality mainly due to its asymmetrical distribution in the favor of rich. In addition, it is observed that non-farm work is positively associated with years of schooling and prevailing infrastructure, for example, in the state of Ecuador (Lanjouw, 2001) where about 40, 50 percent of women and men respectively were engaged in non-farm activities along with farming. A household study conducted in China showed that 72 percent of rural household having sources as non-farm income (De Janvry et al., 2005). The main benefit of non-farm income is that it is a source of income for excess labour in rural areas where there is usually surplus labour with very less marginal productivity in agriculture that can be employed for non-farm activities generating relatively higher returns considering the law of diminishing marginal returns. As a result, the earnings from alternative non-farm activities can assist in improving the quality of life among rural households.
In contrast many researchers including (Zhu and Luo 2006) and revealed an inverse relationship between non-farm income and income inequality of the rural households. Nevertheless, non-farm income plays a key role in the overall rural development while having an eminent share in agricultural households’ incomes (Reardon et al., 2000; De Janvry et al., 2005). In many ways, it is generally believed that off-farm income would significantly add to income of agricultural households and finally reduce the rural poverty (Arif et al., 2000; Lanjouw and Murgai 2008; Foster and Rosenzweig 2004; Roslan and Che-Mat 2011) concluded that agricultural producers adopting non-farm income generating activities spentless lesser time to break the cycle of poverty in comparison to non-participant in farm activities.
So keeping in view the miserable situation of rural poor in Pakistan and an inconclusive nature of the effect of off-farm income on inequality and poverty, the present study is designed to explore the relationship of non-farm income with rural poverty and income inequality amongst agrarian households in the study area.
Materials and Methods
For the study in hand, primary data were collected from the cotton growing agricultural household. The cotton belt in Pakistan has been affected many times by floods causing severe implications for the farmers of this area. Cotton belt in the province of Punjab was selected as its share in total cotton area is around 80% while it has 73% share in the national cotton production (GoP, 2013). Punjab province is divided into nine divisions; among these three top producing divisions were selected. From each of the three divisions, two high cotton producing districts were selected (GoP, 2014). The finally selected districts include Bhawalpur, Bahawalnagr, Muzaffargarh, Rajanpur, Khanewal and Vehari for data collection. From each district, 80 respondents were selected randomly for interview as a result making total sample of 480 farm households. Out of these 480 respondents, 196 respondents have had off-farm income sources in addition to farm income. The off-farm income sources include provision of services in public and private sector, business activities and off-farm labour.
Analytical framework
The study employed by Foster-Greere-Thorbecke 1984index to assess the contribution of income from sources in addition to agriculture in poverty alleviation (Adams 2004; Mukerjee and Benson 2003; Gibson, 2001; De Janvry et al., 2005).The FGT index can be written as;
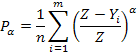
The notation Pα is the representation of FGT index, where ‘n’ is the total number of sample used, ‘m’ is the number of poor households (based on poverty line 2 USD per capita per day), ‘Yi’is the total income of households arranged in increasing order, Z is the poverty line income (threshold of $2 per day) and α is the poverty aversion parameter.
The three parameters depend on the value of α (α=0, α=1, α=2). FGT equation with α value equals to zero will compute the number of people below the poverty line generally called as headcount ratio; while α value equal to 1 will measure the poverty depth or the amount due to which poor family is under the poverty line. In the last case when α=2, it measures the poverty gap squared index for estimating severity of poverty. Moreover, calculations based on α=2 also highlight the variation in income distribution amid the poor households (Adams and Page 2005). Income inequality of sampled households was estimated using Gini coefficient.
Results and Discussion
This section presents the findings of the study along with discussions of salient results in context with the prevailing conditions.
Socioeconomic features of the sampled respondents
Table 1 elucidates the socioeconomic characteristics of the households. The average ageof respondents is 47 years which has an average schooling of 8 years. The average family size was of 9 members while average farm size was 6.88 ha. Farmers had a sufficient farming experience (about 22 years and 18 years’ experience of cotton farming). Similarly, 60 percent respondents were doing fulltime farming while the rest were part time farmers. Part time farmers generally involved in non-farm activities. Among the respondents in the study area, 196 farmers were involved in other activities to earn more income in addition to farm income.
Table 1: Description of explanatory variables used in the model.
| Explanatory Variable | Mean | SD |
| Age (years) | 46.28 | 9.49 |
| Education (years) | 8.27 | 3.28 |
| Farming Experience (Years) | 21.83 | 8.85 |
| Cotton growing experience (years) | 18.03 | 8.74 |
| Location (distance in Km from main city) | 11.93 | 4.60 |
| Farming Area (acres) | 16.67 | 9.01 |
| Family Size | 8.95 | 1.34 |
| Number of livestock | 6.16 | 4.10 |
| Descriptive statistics | ||
| Full time farmer (%) | 60 | |
| Part time farmer (%) |
40 |
|
Non-farm income and poverty
For the present study, the criterion of $2 per day per person (equal to Rs. 202 in Pakistan in 2015) as described by (GoP, 2014) for poverty line calculations was used. In other words, a household was considered as poor if the per capita household income was less than Rs.202 while for non-poor households, the per capita income had to be equal or more than Rs. 202. The results reveal that more than 50 percent households were below poverty line. Moreover, almost one-tenth of the households had per capita income even less than Rs. 100 (< $1) and who could be categorized as absolute poor. On the other hand, majority of the non-poor households just escaped poverty as they were marginally above the poverty line having per capita income within the range of Rs. 200 and Rs. 300 ($2-$3). Only 16% of the respondent farm households had per capita income more than Rs. 300 (> $3).
Table 2: Poverty level and extent across various categories of farmers based on income sources.
| Pα | Agriculture income only | Agriculture and Non-farm income | Agriculture and unearned income | Income from all sources (1+2+3) | % change | % change | % change |
| (1) | (2) | (3) | (4) | [(2-1)/ 1*100] | [(3-1)/ 1*100] | [(4-1)/ 1*100] | |
| α=0 | 0.679 | 0.579 | 0.652 | 0.548 | -14.725 | -3.991 | -19.320 |
| α=1 | 0.247 | 0.176 | 0.234 | 0.167 | -28.751 | -5.257 | -32.673 |
| α=2 | 0.120 | 0.077 | 0.113 | 0.073 | -36.106 | -5.574 |
-39.351 |
Table 2 describes the level of rural poverty with different sources of income while considering income from agriculture as base in the study areas. The results show that non-farm income contributes more in poverty alleviation of the households as compared to unearned income such as income from gifts, remittances or any other source without offering any service. The non-farm income supports farm earnings and helps reduce poverty levels. Choosing α=0 for the level of poverty in case of farm income as the only income source, about 68% households were observed to be below poverty line ($2 per day). In the case when non-farm income is added to agricultural income, a decrease of about 15% in the level of poverty as compared to baseline category is observed leaving 58% respondents below poverty line. Finally, when farmers do have unearned income in addition to agricultural income then about 65% of them fall below poverty line. Adding upall three sources of income (i.e. agricultural, non-farm and unearned) pulls up some households from poverty but still 54% of them remain under poverty line.
Results in Table 2 reveal that when α=0, it only shows the level of poverty rather than its depth, indicating how many people are below the poverty line. In the second scenario with α=1, the amount by which households are below the poverty line is given while in the last case when α=2, the severity of poverty is estimated. The analysis revealed that the non-farm income coupled with unearned income augment farm income to reduce depth and severity of poverty among the rural households. The value of FGT index after adding non-farm income to the income from agriculture show that the level of poverty declines by 14.72%, whereas accumulating unearned income with agricultural income only reduces poverty by 3.9%. However, adding all three sources of income reduces poverty up to 19.32% which is the maximum reduction as reported by (Adewunmi et al., 2011; Che-mat et al., 2012). Similarly, the values of poverty gap and squared poverty gap also decline as income from non-farm sectors and unearned income are added to the agricultural income.
Calculation of Gini coefficient
To determine the contribution of non-farm income to the income inequality,Gini coefficient was used. To calculate the Lorenz curve and Gini coefficient, following formula was used taking insights from (Theil, 1967 and Ahmad et al., 2003):

The Lorenz ratio was calculated using the following equation:
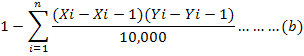
Where;
Y: Cumulative percentage of income; X: Cumulative percentage of population.
For analytical purpose, the income of 480 respondents was segregated into five subcategories as shown in Table 3.
Using Eq. (b) and values in Table 3, for the calculated value for Lorenz curve is given by:
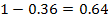
The calculated value for Gini Coefficient is 0.77 which lies between 0 and 1. As Gini Coefficient gives a relative measure, the zero value indicates perfect equality whereas 1 indicates perfect inequality. Broadly speaking, it shows the income distribution among the selected sample or population respectively for an area or a country. The calculated value of Gini Coefficient for our sample shows more inequality of income distribution.
Table 3: Calculation for Lorenz curve and gini coefficient.
| Farm income | Sum of income b/w ranges | Number of People between range | % of income | % of population | % of income/% of population | Cumulative of % of income (Y) | Cumulative of % of population (X) |
| 0 | 0 | ||||||
| Above 14000 | 578,742 | 3 | 2.53 | 0.63 | 4.06 | 2.53 | 0.63 |
| 105000- > 140000 | 1,283,820 | 11 | 5.62 | 2.29 | 2.45 | 8.15 | 2.92 |
| 70000 - > 105000 | 4,839,390 | 59 | 21.19 | 12.29 | 1.72 | 29.34 | 15.21 |
| 35000 - > 70000 | 12,081,725 | 246 | 52.91 | 51.25 | 1.03 | 82.25 | 66.46 |
| 0 - > 35000 | 4,051,718 | 161 | 17.74 | 33.54 | 0.53 | 99.99 |
100.00 |
Table 4: Calculation for Lorenz curve and Gini coefficient.
| Total income | Sum of income b/w ranges | Number of People between range | % of income | % of population | % of income/% of population | Cumulative of % of income (Y) | Cumulative of % of population (X) |
| 0 | 0 | ||||||
| Above 14000 | 578,742 | 3 | 2.26 | 0.63 | 3.61 | 2.26 | 0.63 |
| 105000- > 140000 | 1,283,820 | 20 | 8.79 | 4.17 | 2.11 | 11.05 | 4.8 |
| 70000 - > 105000 | 4,839,390 | 88 | 27.33 | 18.33 | 1.49 | 38.38 | 23.13 |
| 35000 - > 70000 | 12,081,725 | 270 | 51.96 | 56.25 | 0.92 | 90.34 | 79.38 |
| 0 - > 35000 | 4,051,718 | 99 | 9.67 | 20.63 | 0.47 | 100.01 |
100.00 |
Figure 1 depicts the distribution of sample respondents according to their income from agriculture (Lorenz Curve).
By adding non-farm income or any other type of income to the farm income, total income of respondents is increased. Under such a case, the results for the calculation of Gini Coefficient and Lorenz Curve are given in Table 4.
The estimated value for Lorenze curve is:
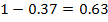
Similarly, the value for Gini Coefficient is 0.83. This value is greater than the value obtained in case of only farm income implying slightly greater income inequality when other than farm income is added with farm income. In this way, it is observed that off-farm income may increase inequality among farm households.
Figure 2 shows two types of curves. One curve is for the sample respondents when only farm income is taken into account. However, when total household income from all sources including off-farm income is considered, the curve gets further away from equality line compared to the curve for farm income only. These result simply that adding non-farm income has a positive impact on income inequality, i.e. income distribution becomes more uneven. Such results also have been reported by (Mat et al., 2012; Adams, 2001).There may be a multitude of factors causing this distortion in income distribution once off-farm income sources are considered. Such factors may include farmers’ and farm-related attributes as well as the nature of off-farm activities. These aspects need further research for an in-depth investigation.
Conclusions and Recommendations
The study used primary data collected from the cotton farmers to value the effect of non-farm income on poverty and income inequality among selected farm households. The results revealed that about 67 percent farm households were under the poverty line when only agricultural income was considered but after adding income obtained from non-farm sources, the percentage of population below the poverty line decreased to 57 percent. According to Gini Coefficient calculations, addition of non-farm income raises the income inequality among farm households. Hence, it is concluded that off-farm income sources reduce poverty whereas increase income inequality. Further research is warranted in order to investigate the dynamics and nature of influencing factors that lead to the worsening of income distribution among farm households.
On the basis of this conclusion it is recommended that addition of income from off-farm sources are helpful to reduce the poverty among rural households. So to encourage the people by adopting income sources other than agriculture can positively affect the household income and their livelihood.
Author’s Contribution
Muhammad Amjed Iqbal: Developed the idea of manuscript and prepared the draft
Azhar Abbas and Raza Ullah: Helped in application of model and data analysis.
Umar Ijaz Ahmed and Ali Sher: Extended their cooperation for grammer and sentence correction.
Shoaib Akhtar: Helped in preparing references and finalizing the manuscript.
References
Adams Jr, R.H. 2004. Remittances and poverty in Guatemala. World Bank Policy Research Working Paper. (3418).
Adams, R.H. 2001. Nonfarm income, inequality, and poverty in rural Egypt and Jordan (Vol. 2572). World Bank Publications. https://doi.org/10.1596/1813-9450-2572
Adams, R. H. and J. Page. 2005. Do international migration and remittances reduce poverty in developing countries? World dev. 33(10): 1645-1669. https://doi.org/10.1016/j.worlddev.2005.05.004
Adewunmi, O.I., B. Adesimi and O.A. Ezekiel. 2011. Non-farm activities and poverty among rural farm households in Yewa division of Ogun State, Nigeria. J. Soc. Sci. 26(3): 217-224.
Ahmad, M., S. Hussain and M.A. Chaudhry. 2003. An economic appraisal of structural changes in land holdings in North Western frontier province (NWFP) of Pakistan. Small. 736(540.17): 666-8.
Arif, G.M., H. Nazli, R. Haq and S.K. Qureshi. 2000. Rural Non-agriculture employment and poverty in Pakistan [with Comments]. Pak. Dev. Rev. 1089-1110.
Barrett, C.B., M.B. Clark, D.C. Clay and T. Reardon. 2005. Heterogeneous constraints, incentives and income diversification strategies in rural Africa. Quarterly J. Int. Agric. 44(1): 37-60.
Canagarajah, S., C. Newman and R. Bhattamishra. 2001. Non-farm income, gender, and inequality: evidence from rural Ghana and Uganda. Food policy. 26(4): 405-420. https://doi.org/10.1016/S0306-9192(01)00011-2
Che-Mat, S.H.C., A.Z.Z. Jalil, and M. Harun. 2012. Does Non-farm income improve the poverty and income inequality among agricultural household in rural Kedah? Procedia Econom. Finance. 1: 269-275. https://doi.org/10.1016/S2212-5671(12)00031-7
Csaki, C., Z. Lerman. 2000. Agricultural Transition revised: Issues of land reforms and farm restructuring in east central europe and the former USSR. Washington DC: World Bank.
Davis, J.R., D.J. Bezemer. 2001. The Development of the rural non-farm economy in developing countries and transition economies. Globalization and Rural Poverty in Transition Economies, United Nations, New York.
De Janvry, A.E. and Sadoulet. 2001. Income strategies among rural households in Mexico: The role of off-farm activities. World dev. 29(3): 467-480. https://doi.org/10.1016/S0305-750X(00)00113-3
De Janvry, A., E. Sadoulet. And N. Zhu. 2005. The role of non-farm incomes in reducing rural poverty and inequality in China. Department of Agricultural and Resource Economics, UCB.
Elbers, C. and P. Lanjouw. 2001. Intersectoral transfer, growth, and inequality in rural Ecuador. World Dev. 29(3): 481-496. https://doi.org/10.1016/S0305-750X(00)00110-8
Ellis, F. and H.A. Freeman. 2004. Rural livelihoods and poverty reduction strategies in four African countries. J. Dev. Stud. 40(4): 1-30. https://doi.org/10.1080/00220380410001673175
Foster, A. D. and M.R. Rosenzweig. 2004. Agricultural productivity growth, rural economic diversity, and economic reforms: India, 1970–2000. Econom. Dev. Cult. Change. 52(3): 509-542. https://doi.org/10.1086/420968
Foster, J., J. Greer and E. Thorbecke. 1984. A class of decomposable poverty measures. Econometrica: J. Econom. Soc. 761-766.
Gibson, J. 2001. Measuring chronic poverty without a panel. J. Dev. Econom. 65(2): 243-266. https://doi.org/10.1016/S0304-3878(01)00136-5
GoP. 2013. Agricultural statistics of Pakistan. 2012–13. Ministry of Food and Agriculture (economic Wing), Finance Division, Government of Pakistan, Islamabad.
GOP. 2014. Economic Survey of Pakistan. 2013-2014. Economic Advisor’s Wing, Finance Division, Islamabad, Pakistan.
GOP. 2014. Punjab Development Statistics, Bureau of Statistics, Government of Punjab, Lahore, Pakistan.
Haggblade, S., P.B. Hazell and T. Reardon, (Eds.). 2007. Transforming the rural nonfarm economy: Opportunities and threats in the developing world. Int. Food Policy Res. Inst.
Haggblade, S., P. Hazell and T. Reardon. 2005. The rural nonfarm economy: Pathway out of poverty or pathway in? In International Food Policy Research Institute. The future of small farms. Proceedings of a research workshop, Wye, UK. pp. 151-178.
Haq, M.A.U., K. Ayub and I. Ullah. 2015. Micro-level determinants of rural poverty in Pakistan. Int. J. Sci. Res. Publ. 5(2): 1-4.
Human Development Report. 2013. UNDP. http://hdr.undp.org/en/2013-report
IFAD. 2012. Enabling poor rural people to overcome poverty in Pakistan, Rural poverty in Pakistan.
Khan, R.E.A., H. Rehman and M. Abrar-ul-Haq. 2015. Determinants of rural household poverty: The Role of Household Socioeconomic Empowerment. Am.-Eur. J. Agric. Environ. Sci. 15(1). 93-98.
Lanjouw, P. 2001. Nonfarm employment and poverty in rural El Salvador. World Dev. 29(3): 529-547. https://doi.org/10.1016/S0305-750X(00)00105-4
Lanjouw, P. and R. Murgai. 2008. Poverty decline, agricultural wages, and non-farm employment in rural India. The World Bank Development Research Group. Policy Research Working Paper. 4858.
Mat, S.H.C., A.Z.A. Jalil and M. Harun. 2012. Does Non-farm income improve the poverty and income inequality among agricultural household in rural Kedah? Procedia Econom. Finance. 1: 269-275. https://doi.org/10.1016/S2212-5671(12)00031-7
Mukherjee, S. and T. Benson. 2003. The determinants of poverty in Malawi, 1998. World Development. 31(2): 339-358. https://doi.org/10.1016/S0305-750X(02)00191-2
NDMA. 2015. National Disaster Management Authority. Annual Report 2010, Available online at http://www.ndma.gov.pk/new/resources/annualreports.php accessed on 10/06/2015
Ping, Q., M.A. Iqbal, M. Abid, U.I. Ahmed, A. Nazir and A. Rehman. 2016. Adoption of Off-farm diversification income sources in managing agricultural risks among cotton farmers in Punjab Pakistan. J. Appl. Environ. Biol. Sci. 6(8): 47-53.
Reardon, T., K. Stamoulis, A. Balisacan, M.E. Cruz, J. Berdegué and B. Banks .1998. Rural non-farm income in developing countries. The state of food and agric. 283-356.
Reardon, T., J.E. Taylor, K. Stamoulis, P. Lanjouw and A. Balisacan. 2000. Effects of non‐farm employment on rural income inequality in developing countries: an investment perspective. J. Agric. Econom. 51(2): 266-288. https://doi.org/10.1111/j.1477-9552.2000.tb01228.x
Roslan, A. H. and S.H. Che-Mat. 2011. Non-Farm activities and time to exit poverty: A Case Study in Kedah, Malaysia. World Rev. Bus. Res. 1(2): 113-124.
Ruben, R. 2001.Nonfarm employment and poverty alleviation of rural farm households in Honduras. World Dev. 29(3): 549-560. https://doi.org/10.1016/S0305-750X(00)00107-8
Theil, H. 1967. Economics and information theory Amsterdam: North Holland.
UNDP. 2002. Human Development Report, Washington, DC. USA.
Woldehanna, T. 2002. Rural farm/nonfarm income linkages in northern Ethiopia. Promoting farm/nonfarm linkages for rural development: Case studies from Africa and Latin America, Rome: FAO. 121-144.
Zhu, N. and X. Luo. 2006. Nonfarm activity and rural income inequality: A case study of two provinces in China. World Bank Policy Research Working Paper 3811, The World Bank, Washington, DC.
To share on other social networks, click on any share button. What are these?


