

Comparing Predictive Performances of MARS and CHAID Algorithms for Defining Factors Affecting Final Fattening Live Weight in Cultural Beef Cattle Enterprises


Comparing Predictive Performances of MARS and CHAID Algorithms for Defining Factors Affecting Final Fattening Live Weight in Cultural Beef Cattle Enterprises
Adem Aksoy1, Yakup Erdal Ertürk2, Ecevit Eyduran3 and Mohammad Masood Tariq4,*
1Department of Agricultural Economics, Agricultural Faculty, Ataturk University, Erzurum, Turkey
2Department of Agricultural Economics, Agricultural Faculty, Iğdır University, Iğdır, Turkey
3Department of Business Administration, Faculty of Faculty of Economics and Administrative Sciences, Iğdır University, Iğdır, Turkey
4Centre of Advanced Studies in Vaccinology and Biotechnology, University of Balochistan, Quetta, Pakistan
ABSTRACT
This study was conducted to define vital factors on final fattening live weight (FFW) on cultural beef cattle enterprises from Eastern region of Turkey. Predictive performances of Multivariate Adaptive Regression Splines (MARS) and Chi-Square Interaction Detector (CHAID) were evaluated comparatively in the definition of significant factors and interaction effects between the factors. Before the definition process, the data on socio-economic (age, province, educational level, experience, social security, lands and the reason at ranching of the animal breeders) and biological factors (sex, first live weight before fattening and fattening period of the beef cattle) were recorded from the related beef cattle enterprises. For the statistical evaluation of MARS algorithm, the package “earth” of the R software was employed based on the smallest GCV value. In the CHAID algorithm, minimum enterprise numbers in parent and child nodes were set at 4 and 2 for ensuring strong predictive accuracy with the Bonferroni adjustment. MARS algorithm gave a very good performance in the prediction of final fattening weight according to goodness of fit criteria i.e. R2 (0.983) and SDRATIO (0.114). Very strongly significant Pearson correlation coefficient (r=0.992) between observed and predicted FFW values in the MARS were found for the cultural beef cattle enterprises, respectively (P<0.01). The respective model evaluation criteria for CHAID algorithm were estimated as 0.671 R2 and 0.574 SDRATIO. Whereas, the respective correlation coefficient for CHAID algorithm was 0.819 (P<0.01). MARS outperformed CHAID algorithm in predictive quality. In the CHAID algorithm, the first live weight, farmer’s age, pasture land, SOCSEC, fattening period and sex of the beef cattle were found for FFW as the influential predictors, whereas main and interaction effects of all the predictors handled here were found significant in the MARS. In conclusion, the results represented that MARS may submit meaningful hints to enterprises in the description of noticeable factors on FFW for further studies to be conducted under similar conditions.
Article Information
Received 23 November 2017
Revised 03 March 2018
Accepted 11 April 2018
Available online 11 October 2018
Authors’ Contribution
AA conceived and designed the study and collected the data. EE analysed the data statistically. MMT interpreted the data and wrote the article. YEE helped in interpreting the data.
Key words
Final fattening weight, Cultural beef cattle, MARS, CHAID, Data mining, Production economics.
DOI: http://dx.doi.org/10.17582/journal.pjz/2018.50.6.2279.2286
* Corresponding author: tariqkianiraja@hotmail.com
0030-9923/2018/0006-2279 $ 9.00/0
Copyright 2018 Zoological Society of Pakistan
Introduction
Turkey is a country that makes a traditional production for red meat from beef cattle in order to meet essential protein needs for healthy nourishment of the current and next generations. To supply increasing demand for red meat in Turkey, beef cattle production had a significant share with the existence of the native, crossbred and exotic beef cattle breeds. Among these, cultural beef cattle breeds are prominent gene sources and can be mated with indigenous beef cattle breeds to produce heavier crossbred offspring in live weight trait with a high heritability. With the recent biotechnological developments, native beef breeds have been inseminated artificially by using qualified sperms of the cultural breeds for producing superior offspring, which is a great effort to progress rural economy. In beef cattle rearing, FFW, an economically considerable trait affected by genetic and environmental factors, is influenced by first fattening weight influencing profitability and efficiency of the beef cattle production (Demircan, 2008). Several important factors (breed, gender, age, season, first live weight before fattening, fattening period, feeding regime, health status, housing system etc.) on FFW in beef cattle production were mentioned by previous authors (Demircan, 2008; Aytekin et al., 2017). However, more comprehensive knowledge on the effect of socioeconomic factors on FFW for the beef cattle enterprises is still needed together with biological factors addressed above (Abo-Elfadl et al., 2015). Demircan et al. (2007) studied the impact of season on fattening performance and profitability in beef cattle enterprises. A straightforward explanation of efficient predictors on FFW is affiliated with taking proper and robust statistical methodologies i.e. artificial intelligence algorithms (Aytekin et al., 2017).
Some documentations were present on FFW in respect of different beef cattle breeds i.e. Indigenous, Brown Swiss, Simmental, Holstein Fresian etc. (Koknaroglu et al., 2005; Aydın et al., 2014; Sarma et al., 2014; Abo-Elfadl et al., 2015; Muižniece and Kairiša, 2016; Aytekin et al., 2017). Demircan (2008) reported a significant influence of first fattening weight on sustainability of the beef cattle production in feedlots. Dadi et al. (2017) evaluated fattening performance in commercial beef cattle production. Gozener and Sayili (2015) reported significant predictors for live weight gain in beef cattle enterprises. Abo-Elfadl et al. (2015) recommended a simultaneously investigation of economic, biological and social predictors affecting FFW to increase efficiency of the beef cattle production.
Statistical analysis of describing influential factors in regard to final fattening weight is important to be concurrently made by robust data mining techniques i.e., CHAID (Akin et al., 2017a, b, c, d), CART (Kowalchuk et al., 2017; Akin et al., 2017d), Exhaustive CHAID (Akin et al., 2017d), MARS, multilayer perceptron (MLP) and Radial basis function (RBF) etc. However, use of the abovementioned techniques to capture operative factors on FFW is still rare (Aytekin et al., 2017). Among these, the first three algorithms are tree-based algorithms that are more easily interpretable visually, whereas MARS can provide an opportunity of making more accurate elucidation on non-linear and interaction effects significantly affecting FFW. The significant biological, socio-economic factors and their high interaction effects in terms of FFW may be exhibited concurrently through MARS algorithm. Hence, an attempt was made in the current study to define noticeable factors on FFW for cultural beef cattle enterprises from Eastern region of Turkey by comparatively using MARS and CHAID in the characterization of significant factors and interaction effects between these considerable factors with the aim of improving productivity of the cultural beef cattle production for the future.
Materials and Methods
Data collection and sampling
The questionnaire study was conducted on 145 cultural beef cattle enterprises in Erzurum, Igdir, Kars and Agri provinces of Turkey to describe factors affecting the FFW per enterprise.
Variable structure
FFW was evaluated as a target trait or response variable. Several categorical predictors were sex of the beef cattle (male and female), farmer’s province (Erzurum (44.1%), Igdir (12.4%), Kars (22.8%) and Agri (20.7%)), farmer’s age (year), farmer’s educational degree (illiterate-primary school (49%), secondary school (31.7%), high school (15.9%), and college (3.4%)), farmer’s social security status (available (81.4%) and unavailable (18.1%)). Some continuous predictors were expressed as mean ± standard deviation; namely, farmer’s experience in animal production (year, 26.4±11.7), farmer`s irrigated land (da, 96±88.6), farmer`s dry land (da, 142±104.8), farmer`s pasturage land (da, 75±27.1), the first live weight before fattening (kg, 283±99.9), and fattening period (day, 174±70.4).
Statistical analysis
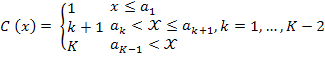
CHAID algorithm just runs for nominal or ordinal categorical independent variables. Therefore, continuous predictors are transformed into ordinal predictors before identifying the following algorithm. For a known set of break points a1, a2,……,aK-1 (in ascending order), a known x is mapped into category C(x) as follows:
When K is the preferred number of bins, for the approximation of the break points xi frequency weights are unified in calculating the ranks. In the event of being ties, the average rank is employed. The rank and the respective values in ascending order can be defined as:

For k = 0 to (K−1), set:
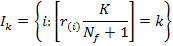
Where, (x) displays the floor integer of x. If Ik is not empty, ik = max{I : I ϵ Ik}, the adjustment on behalf of the break points is done by becoming equal to the x values corresponding to the ik, excluding the largest (Breiman et al., 1984).
Bonferroni adjustment was taken a basis for CHAID algorithm in estimating Adjusted P values of F values. The CHAID tree based algorithm with an automatically pruning process in removing needless nodes in the decision tree uses F significance test. This pruning (pre-pruning) used in CHAID is different from the post-pruning used e.g. in CART, in which a too complex tree grown at an earlier stage of the analysis is then pruned back by eliminating redundant nodes at a later stage.
MARS as a-non parametric regression methodology was executed to improve a helpful prediction model which ascertains interaction effects of imperative factors in the representation of the momentous factors in FFW as a response continuous variable.
The MARS algorithm was employed here:
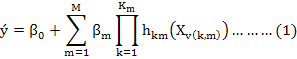
Where, ý is the predicted FFW value as a response variable, β0 is a constant, hkm (Xv(k,m)) is the basis function, in which v(k,m) is an index of the predictor for the mth component of the kth product, Km is the parameter on limiting the order of interaction.
The maximum number of basis functions in the MARS analysis was 100 and the three-order interactions were considered based on the lowest GCV. After building the most complex MARS model, the basis functions that decrease the quality of the model performance were removed from the prediction equation in pruning process depending upon generalized cross-validation error (GCV):
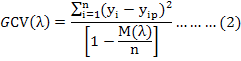
Where, n is the number of training cases, yi is the observed FFW value, yip is the predicted FFW value, M(λ) is a penalty function related to the complexity of the model containing λ terms.
We have used a cross validation of 10 for both algorithms. Obtaining the least difference between the cross validation cost and resubstitution cost estimated for learning sample was important for the best solution in the CHAID in the IBM SPSS software. MARS was also specified by V tenfold cross validation together with penalty=2 to prevent overfitting performance in R software. Previous simulation studies suggested penalty values of 2 to 4. We performed the best estimation in penalty=2.
Goodness of fit criteria for computing predictive accuracy of the CHAID and MARS algorithms are formulated below:
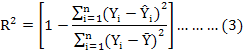
Coefficient of determination
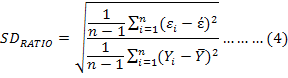
Standard Deviation Ratio
Pearson’s correlation coefficient between actual and predicted FFW scores (5).
Where, Yi the observed FFW (kg) value associated with ith cultural beef enterprise, Ŷi is the predicted FFW of ith cultural beef enterprise, Ȳ is arithmetic mean of the FFW values associated with all the cultural beef enterprises, εi is the individual residual value of ith cultural beef enterprise, έ is arithmetic mean of the residual values, and n: number of total cultural beef enterprises. The individual residual value of each cultural beef enterprise is found as εi = Yi - Ŷi.
Results and Discussion
CHAID algorithm results
Figure 1 presented the regression tree diagram built by CHAID algorithm in the prediction of FFW for cultural beef cattle enterprises. The predicted FFW scores were significantly correlated with the real FFW in the cultural beef cattle enterprises (r=0.819, P=0.000). In addition, SDRATIO for CHAID algorithm was estimated as 0.574.
CHAID regression tree diagram presented that the first fattening weight before fattening was the most influence predictor on FFW (Adjusted P= 0.000, F=56.050, df1=3 and df2=141). At top of the regression tree diagram, a root node (Node 0) containing all the enterprises in the study generated an overall average of 488.393 kg in the FFW per enterprise.
The root node was unsurprisingly split into four smaller subgroups (Nodes 1-4) by the first fattening weight before fattening, as a good predictor, respectively. The averages of the FFW from Node 1 to Node 4 subgroup increased as a result of increasing first live weight before fattening. The present findings were consistent with those reported by Demircan (2008) who emphasized the importance of the first live weight in the beef cattle production.
Node 1 was the subgroup of enterprises that reared cultural beef cattle with 200 or lighter fattening weights and in the first group, an average FFW of 297.500 kg was predicted.
It was reported that fattening period was a significant source of variation in FFW for the beef cattle production (Abo-Elfadl et al., 2015; Aytekin et al., 2017). When Node 3 (the subgroup of enterprises rearing cultural beef cattle with 280 < initial live weight < 400 kg) was examined, the effect of PL on the FFW in the beef cattle could be changed by levels of farmer’s age, and sex of the beef cattle. These results obtained for Nodes 2, 5, 6, 11 and 12 were in disagreement with those given in earlier publications (Abo-Elfadl et al., 2015; Aytekin et al., 2017). For Node 3, the heaviest mean FFW of 736 kg in the CHAID analysis was obtained by enterprises’ age ranging from 46 to 49 with PL < 12 da and reared the beef cattle with the first live weight of (280, 400] kg. Abo-Elfadl et al. (2015) reported that socio-economic and biological factors conjointly influenced FFW in assuring better level of the beef cattle production.
Sex had an important effect on FFW performance (Demircan et al., 2007; Dadi et al., 2017). However, sex factor was determined to be a significant factor for only enterprises rearing cultural beef cattle with 280 < initial live weight < 400 kg, having PL > 12 da. This also confirmed the declaration of Abo-Elfadl et al. (2015).
No significant predictors affecting the FFW for enterprises that reared cultural beef cattle with the first live weight heavier than 400 kg were noted (Node 4). The data might be a principal hint in practice for cultural beef cattle enterprises in the region handled here.
MARS algorithm
MARS algorithm produced a prediction model estimating the smallest GCV and the respective results are summarized in Table I. The R2 value of 0. 9832 estimated for the MARS predictive model indicated that the constructed model explained just about all of the variability in the FFW in cultural beef cattle enterprises. A very strongly correlation of 0.992 was found between the observed and predicted FFW scores (P<0.001). The respective SD ratio gave a very good fit with 0.114. According to the goodness of fit criteria, MARS showed a very good fit and outperformed CHAID in the predictive accuracy of FFW.
Table I.- Results of MARS algorithm for the final fattening live weight in cultural beef cattle.
|
Basis functions |
Coefficients |
|
Intercept EDUL_highschool max(0, 20-EFAP) max(0, EFAP-20) max(0, 200-DLF) max(0, DLF-200) max(0, 120-FATPERIOD) max(0, FATPERIOD-120) max(0, FIRSTLIVEWEIGHT-200) max(0, 350-FIRSTLIVEWEIGHT) max(0, FIRSTLIVEWEIGHT-350) EDUL_COLLEGE * max(0, 350-FIRSTLIVEWEIGHT) EFAP * max(0, DLF-200) APAP_HOME&TRADE * max(0, DLF-200) max(0, 200-DLF) * SEXM max(0, FIRSTLIVEWEIGHT-200) * SEXM max(0, FIRSTLIVEWEIGHT-350) * SEXM max(0, 47-FARMERAGE) * max(0, FATPERIOD-120) max(0, FARMERAGE-47) * max(0, FATPERIOD-120) max(0, 50-FARMERAGE) * max(0, FIRSTLIVEWEIGHT-200) max(0, FARMERAGE-50) * max(0, FIRSTLIVEWEIGHT-200) max(0, EFAP-20) * max(0, DLF-13) max(0, EFAP-20) * max(0, 13-DLF) max(0, 18-EFAP) * max(0, 350-FIRSTLIVEWEIGHT) max(0, EFAP-18) * max(0, 350-FIRSTLIVEWEIGHT) max(0, EFAP-20) * max(0, FIRSTLIVEWEIGHT-300) max(0, EFAP-20) * max(0, 300-FIRSTLIVEWEIGHT) max(0, 38-ILF) * max(0, FATPERIOD-120) max(0, ILF-38) * max(0, FATPERIOD-120) max(0, 40-DLF) * max(0, FIRSTLIVEWEIGHT-200) max(0, DLF-40) * max(0, FIRSTLIVEWEIGHT-200) max(0, 200-DLF) * max(0, FIRSTLIVEWEIGHT-300) max(0, 200-DLF) * max(0, 300-FIRSTLIVEWEIGHT) max(0, 25-PF) * max(0, FIRSTLIVEWEIGHT-200) max(0, PF-25) * max(0, FIRSTLIVEWEIGHT-200) max(0, FATPERIOD-120) * max(0, FIRSTLIVEWEIGHT-300) max(0, FATPERIOD-120) * max(0, 300-FIRSTLIVEWEIGHT) max(0, FATPERIOD-120) * max(0, FIRSTLIVEWEIGHT-270) max(0, 180-FATPERIOD) * max(0, 350-FIRSTLIVEWEIGHT) max(0, FATPERIOD-180) * max(0, 350-FIRSTLIVEWEIGHT) PROVINCE_IGDIR * max(0, FIRSTLIVEWEIGHT-350) * SEXM EDUL_secondaryschool * max(0, FIRSTLIVEWEIGHT-350) * SEXM PROVINCE_ERZURUM * max(0, 47-FARMERAGE) * max(0, FATPERIOD-120) PROVINCE_KARS * max(0, DLF-40) * max(0, FIRSTLIVEWEIGHT-200) max(0, FARMERAGE-47) * APAP_TRADE * max(0, FATPERIOD-120) max(0, 40-FARMERAGE) * max(0, FIRSTLIVEWEIGHT-200) * SEXM max(0, FARMERAGE-40) * max(0, FIRSTLIVEWEIGHT-200) * SEXM EDUL_highschool * max(0, FATPERIOD-120) * max(0, 300-FIRSTLIVEWEIGHT) |
384.87911 7.11997 15.91426 0.79740 0.47125 -2.94026 0.17154 -0.88915 -0.46506 0.10874 0.29996 1.81014 0.09148 0.85320 -0.21121 0.37258 -3.10924 -0.07735 0.00503 0.00877 -0.02602 -0.01879 -0.20737 0.02416 0.02441 -0.02521 -0.02456 -0.00307 0.00084 0.00677 0.00947 0.00787 -0.00412 -0.01456 0.00667 -0.06258 -0.00298 0.06257 -0.00719 0.01533 -4.29574 3.43052 0.11606 0.00518 -0.17463 0.35752 0.04758 -0.00664 |
|
EDUL_COLLEGE * max(0, 18-EFAP) * max(0, 350-FIRSTLIVEWEIGHT) |
-0.40413 |
|
Basis functions |
Coefficients |
|
max(0, 25-EFAP) * max(0, FIRSTLIVEWEIGHT-200) * SEXM |
-0.07910 |
|
max(0, EFAP-25) * max(0, FIRSTLIVEWEIGHT-200) * SEXM |
-0.01070 |
|
APAP_TRADE * max(0, FATPERIOD-120) * max(0, 300-FIRSTLIVEWEIGHT) |
0.01324 |
|
max(0, 20-ILF) * max(0, FIRSTLIVEWEIGHT-200) * SEXM |
0.02673 |
|
max(0, ILF-20) * max(0, FIRSTLIVEWEIGHT-200) * SEXM |
0.00389 |
|
max(0, FARMERAGE-47) * max(0, FATPERIOD-120) * max(0, FIRSTLIVEWEIGHT-250) |
0.00096 |
|
max(0, FARMERAGE-47) * max(0, FATPERIOD-120) * max(0, 250-FIRSTLIVEWEIGHT) |
-0.00050 |
|
max(0, 50-ILF) * max(0, 40-DLF) * max(0, FIRSTLIVEWEIGHT-200) |
0.00066 |
|
max(0, ILF-50) * max(0, 40-DLF) * max(0, FIRSTLIVEWEIGHT-200) |
-0.00074 |
|
max(0, 40-DLF) * max(0, PF-20) * max(0, FIRSTLIVEWEIGHT-200) |
-0.00029 |
|
max(0, 40-DLF) * max(0, 20-PF) * max(0, FIRSTLIVEWEIGHT-200) |
-0.00119 |
|
EDUL_secondaryschool * DLF * max(0, FIRSTLIVEWEIGHT-350) * SEXM |
-0.45972 |
|
max(0, 40-FARMERAGE) * EDUL_highschool * max(0, FIRSTLIVEWEIGHT-200) * SEXM |
-0.32736 |
|
max(0, FARMERAGE-40) * max(0, PF-10) * max(0, FIRSTLIVEWEIGHT-200) * SEXM |
-0.00194 |
|
max(0, FARMERAGE-40) * max(0, 10-PF) * max(0, FIRSTLIVEWEIGHT-200) * SEXM |
-0.00213 |
|
EDUL_secondaryschool * max(0, ILF-50) * max(0, 40-DLF) * max(0, FIRSTLIVEWEIGHT-200) |
0.00029 |
|
EFAP * max(0, ILF-50) * max(0, 40-DLF) * max(0, FIRSTLIVEWEIGHT-200) |
0.00004 |
PROVINCE, this presents province where farmer lives, (Erzurum, Agri, Igdir and Kars); FARMERAGE, age of Farmer; EDUL, education level (illiterate, primary_school, secondary_school, high_school and college); SOCSEC, social security available and unavailable; APAP, the aim in performing animal production, to meet home’s needs (home), to trade (trade), home and trade (home&trade); EFAP, experience of farmer in animal production; ILF, irrigated land (da) of farmer; DLF, dry land (da) of farmer; PF, pasturage (da) of farmer; FATPERIOD, fattening period (day) of male crossbred beef cattle; FIRSTLIVEWEIGHT, the first live weight before fattening (kg).
Pearson correlations of CHAID and MARS algorithm (0.819 vs. 0.992) showed the predictive superiority of MARS algorithm in the FFW (P<0.05). The present MARS results were a bit better compared with those reported by Aytekin et al. (2017) in the FFW. The achieved results were in accordance with those obtained by Demircan (2008) and Muižniece and Kairiša (2016) who declared the significance of the first live weight before fattening in beef cattle production. Relative importance values of the influential predictors in MARS are presented in Figure 2. The most influential four predictors were first live weight > dry land > fattening period > cattle’s sex (Fig. 2).
Some former authors said that fattening period was a significant source of variation in FFW for the beef cattle production (Abo-Elfadl et al., 2015; Aytekin et al., 2017). As an important source of variation in FFW was reported to be sex of the beef cattle reared (Demircan et al., 2007; Dadi et al., 2017); however, it was observed in our study that the effect of sex factor on FFW could be changed based upon DLF, the first live weight before fattening, farmer’s province, educational level, age, EFAP, ILF, and PF, which supported the declaration of Abo-Elfadl et al. (2015), who highlighted that socio-economic and biological predictors affected FFW in assuring better production level of the beef cattle. In disagreement with those obtained in our study, Kocak et al. (2004) declared the effect of fattening season on fattening performance in Holstein young bulls. Papa and Kume (2010) informed that crossbred cattle’s genetic levels had a significant influence on FFW.
Malole et al. (2014) addressed the ration factor for live weight gain at the end of fattening. Previous authors reported that farmer’s age, educational degree, and number of animals in cattle breeding enterprises in Turkey were prominent factors in cattle breeding (Uzal and Uğurlu, 2006; Han and Bakır, 2009; Aydın, 2011; Aksoy and Yavuz, 2012; Er and Özçelik, 2016).
The large variation in literature were attributable to social factors (farmer’s educational degree, age, province and social security situation), biological and economic factors (season, cattle’s breed, cattle’s sex, first live weight before fattening, and fattening period), managerial conditions, main and interaction effects of these factors as well as, to statistical analysis techniques etc.
Conclusion
In the study, we found predictors affecting FFW in the cultural beef cattle with the help of MARS and CHAID algorithms. Results showed that MARS outperformed CHAID in the predictive accuracy of FFW. In the CHAID algorithm, the first live weight, farmer’s age, pasture land, SOCSEC, fattening period and sex of the beef cattle were found for FFW as the influential predictors, whereas main and interaction effects of all the predictors handled here were found significant in the MARS. In this respect, we advised that social-economic and biological factors in FFW of the cultural beef cattle should be assessed conjointly by MARS algorithm, which is used without requiring any distributional assumption regarding influential predictors. It was concluded that implementation of MARS algorithm may be recommended for future similar studies.
Statement of conflict of interest
Authors have declared no conflict of interest.
References
Abo-Elfadl, E.A., Fardos, A.M. and Radwan, H.A.A., 2015. Quantitative methods to determine factors affecting productivity and profitability of beef fattening enterprises in Egypt. Global Vet., 14: 77-82.
Ahmed, T., Hashem, M.A., Khan, M., Rahman, M.F. and Hossain, M.M., 2010. Factors related to small scale cattle fattening in rural areas of Bangladesh. Bangladesh. J. Anim. Sci., 39: 116-124.
Akin, M., Eyduran, E. and Reed, B.M., 2017a. Use of RSM and CHAID data mining algorithm for predicting mineral nutrition of hazelnut. Pl. Cell Tiss. Cult., 128: 303-316.
Akin, M., Eyduran, E. and Reed, B.M., 2017b. Developing of optimal tissue culture medium for Hazelnuts. IX International Congress on Hazelnut, 15-19 August, Atakum, Samsun, Turkey.
Akin, M., Eyduran, E., Niedz, R.P. and Reed, B.M., 2017c. Developing hazelnut tissue culture medium free of ion confounding. Pl. Cell Tiss. Cult., 130: 483-494.
Akin, M., Hand, C., Eyduran, E. and Reed, B.M., 2017d. Predicting minor nutrient requirements of hazelnut shoot cultures using regression trees. Pl. Cell Tiss. Organ Cult., 132: 545-559. https://doi.org/10.1007/s11240-017-1353-x
Aksoy, A. and Yavuz, F., 2008. An analysis on accordance to European Union and animal husbandry farms; the case of Eastern Anatolia. Turk. J. agric. Econ., 14: 37-45.
Aydın, E., 2011. Kars ve Erzurum İlleri Sığır Besi İşletmelerinin Ekonomik Analizi, (Doktora Tezi). Türkiye Cumhuriyet Ankara Üniversitesi Saglik Bilimleri Enstitüsü Ankara.
Aydin, E., Yeşilyurt, C. and Sakarya, E., 2014. Measuring the performance of cattle fattening enterprises with data envelopment analysis: Comparative analysis of enterprises in the Northeast Anatolia Region (TRA) between the years 2009-2010. J. Facul. Vet. Med. Kafkas Univ., 20: 719-725. https://doi.org/10.9775/kvfd.2014.10958
Aytekin, İ., Eyduran, E., Koksal, K., Akşahan, R. and Keskin, İ., 2017. Prediction of fattening final live weight from some body measurements and fattening period in young bulls of crossbred and exotic breeds using mars data mining algorithm. Pakistan J. Zool., 50: 189-195.
Breiman, L., Friedman, J.H., Olshen, R.A. and Stone, C.J., 1984. Classification and regression trees. Chapman and Hall, Wadsworth Inc., New York, NY, USA.
Dadi, G., Urge, M. and Teklebrhan, T., 2017. Assessment of commercial beef cattle fattening practices and performance in East Shoa Zone. Int. J. agric. Sci. Fd. Technol., 3: 67-76.
Demircan, V., Köknaroglu, H. and Yılmaz, H., 2007. Effect of season on beef cattle performance and profitability. Agric. Trop. Subtrop., 40: 19-23.
Demircan, V., 2008. The effect of initial fattening weight on sustainability of beef cattle production in feedlots. Spanish J. agric. Res., 6: 17-24. https://doi.org/10.5424/sjar/2008061-290
Er, S. and Özçelik, A., 2016. The examination of economic structure of cattle fattening farms in Ankara province by factor analysis. YYU J. agric. Sci., 26: 17-25.
Gözener, B. and Sayili, M., 2015. Production cost and factors affecting live weight gain in cattle fattening in the Turhal district of Tokat province. J. agric. Sci., 21: 288-299.
Han, Y. and Bakır, G., 2009. Structure of private beef farms and affecting factors. J. Facul. Agric., 40: 71-78.
Kocak, Ö., Ekiz, B., Yılmaz, A. and Güneş, H., 2004. Some fattening and slaughter characteristics of Holstein young bulls in intensive conditions. Uludag Univ. J. Facul. Vet. Med., 23: 65-69.
Köknaroğlu, H., Loy, D.D., Wilson, D.E., Hoffman, M.P. and Lawrence, J.D., 2005. Factors affecting beef cattle performance and profitability. Profess. Anim. Scient., 21: 286-296. https://doi.org/10.15232/S1080-7446(15)31220-1
Kovalchuk, I.Y., Mukhitdinova, Z., Turdiyev, T. Madiyeva, G., Akin, M., Eyduran, E. and Reed, B.M., 2017. Modeling some mineral nutrient requirements for micropropagated wild apricot shoot cultures. Pl. Cell Tiss. Cult., 129: 325-335.
Malole, J.L., Kadigi, R.J.M. and Sangeda, A.Z., 2014. Costs and benefits of beef cattle fattening schemes in some selected areas of North West Tanzania. Iranian J. appl. Anim. Sci., 4: 699-706.
Muižniece, I. and Kairiša, D., 2016. Different beef breed cattle fattening results analysis. Res. Rural Develop., 1: 57-62.
Papa, L. and Kume, K., 2010. The effect of Holstein X meat cattle breeds crosses (f1) on meat production increasing in small scale farms conditions. J. Tekirdag Agric. Facul., 7: 49-55.
Sarma, P.K., Raha, S.K. and Jørgensen, H., 2014. An economic analysis of beef cattle fattening in selected areas of Pabna and Sirajgonj Districts. J. Bangl. Agric. Univ., 12: 127-134. https://doi.org/10.3329/jbau.v12i1.21402
Uzal, S. and Uğurlu, N., 2006. The constructural analysis of beef cattle production farms in Konya. Selçuk J. Fd. agric. Sci., 20: 131-139.
To share on other social networks, click on any share button. What are these?


