
An Estimation of Food Demand in Pakistan Using LA/AIDS


Research Article

An Estimation of Food Demand in Pakistan Using LA/AIDS
Irfan Ullah* and Abbas Ullah Jan
Department of Agricultural and Applied Economics, The University of Agriculture, Peshawar, Khyber Pakhtunkhwa, Pakistan.
Abstract | This paper aims to examine the food consumption decisions of the urban and rural household in order to understand the demand for different food commodities and to determine the effects of important economic factors such as prices and income. Flexible Linear Approximate Almost Ideal Demand System model is used to estimate food demand patterns using the Household Integrated Economic Survey of Pakistan for the year 2011-12. Food products are categorized into fourteen groups including milk, meat, fruits, vegetables, sugar, beverages, wheat and wheat flour, rice, other cereals, pulses, oil and fats, tea and coffee, backed products and other food. Economic factors such as food commodities price and household’s income and their socio-economic and demographic characteristics are included in the model. Results indicate that with an increase in the age, household consume more of meat, fruit, wheat and wheat flour, pulses, tea and coffee, backed products and other food in urban region and milk, meat, fruits, vegetables, rice, other cereals, pulses, oil and fats, tea and coffee, backed products and other food in rural region. A significant increase in the consumption of meat, fruits, vegetables, rice, beverages, other cereals and backed products is found for married rural household, while fruits, vegetables, sugar, beverages, wheat and wheat flour, rice, other cereals, oil and fats, backed products and other food consumption increases as urban household is married. Results show a significant increase in the consumption of vegetables, sugar, wheat and wheat flour, rice, oil and fats, pulses, tea and coffee and other food with the addition of individuals in the family in both regions. Prices of basic food items such as milk, meat, rice, other cereals, backed products and other food should be kept constant. Imposition of any sale tax could create huge loss in consumption for these commodities. The demand for most of food groups are own price inelastic in both regions except milk, rice, tea and coffee and backed products which are more than unit elastic to own price. Similarly the demand for most of food groups in both regions are less than unit elastic to total expenditures and have positive sign, while the demand for milk, meat, rice, other cereals and other food products are more elastic to total food expenditures (income) both in rural and urban regions. Imposition of income tax in rural and urban low and middle income household could result in huge decrease in the expenditures on these commodities in Pakistan.
Received | August 03, 2016; Accepted | October 21, 2016; Published | November 14, 2016
*Correspondence | Irfan Ullah, Department of Agricultural and Applied Economics, The University of Agriculture Peshawar, Khyber Pakhtunkhwa, Pakistan; Email: Irfanullah@aup.edu.pk
Citation | Ullah, I., and A.U. Jan. 2016. An estimation of food demand in Pakistan using LA/AIDS. Sarhad Journal of Agriculture, 32(4):
382-393.
DOI | http://dx.doi.org/10.17582/journal.sja/2016.32.4.382.393
Keywords | Demand system, LA/AIDS, Food demand elasticities, Expenditures elasticities, Urban and rural regions
Introduction
Food is a crucial need for healthy life and to meet a successful growth. The world has progressed through hunter gatherer, agricultural, and industrial stages to provider of goods and services. However, in the face of much progress many of the today’s worlds have restricted access to food which ultimately created challenges of food insecurity in many of the developing countries like Pakistan (Haq et al., 2011). Food insecurity is a very consistent challenge for Pakistan due to its annual population growth rate and lack of advancement in agriculture sector, which created an inverse relationship between population and the food produced.
International inflation in food stuff prices and failure in achieving food limits of Pakistan due to frequent natural disasters created a challenging environment for food security in the country (FAO, 2011). Hunger Map of Food and Agriculture Organization (FAO) and Hunger Index of International Food Policy Research Institute (IFPRI) suggested a serious prevalence of starvation and hunger in Pakistan if proper precautions shall not adopt timely (Nazli et al., 2012). Pakistan is currently facing the challenge of food insecurity and also has to face it in future if policies would remain the same. The wider gap between food demand and supply of a country ultimately affect its economic growth, poverty alleviation and development. In order to bring all these developments in hands Pakistan need to match the supply of food with the population demands at an easy access for poor’s.
Both in urban and rural areas of Pakistan, poverty is a common outfit of large population whose major part of income is consumed by food in contrast to other household expenditures which may be estimated as 80.42% (GoP, 2015). In 2013-14 these expenditure were controlled and were brought down in urban and rural areas upto 43.63% from 45.01% in 2011-12. Major portion (54.75%) of food expenditures is spent on sugar, vegetable ghee and vegetables, milk and wheat. whereas, the poorest spend 65.63% of their food expenditure on milk, sugar, wheat, vegetable, and vegetable ghee in contrast to the richest who spend 58.54% on milk, vegetables, wheat, fruits, sugar, mutton, beef, chicken etc. (GoP, 2015). This also shows the differences in both the rich and poor classes’ preference towards food, therefore, differences in classes and high prices may affect supply and demand of food and also restrict the approach of poorer to quality food (Burki, 1997).
The progress and development of any economy is connected with the consumption in a way that it measures the welfare of the people who are making expenditure on the purchase of various consumption heads. In fact consumption activity may call the backbone of all the supply and demand and all sort of investment is evolving around it directly or indirectly. Food accumulated the top priority as it is being the basic need to sustain life of individuals. Since the guesstimates about the purchasing power of food are required to design a batter food policy to set priorities, understanding the relationship between household consumption and income provide acumen for consumer behaviour. In this connection food consumption is an important aspect in economic theory for this reason it has been studied widely and a number of valuable researches should be carried out to understand the challenges and opportunities associated with it (Ahmad et al., 2015).
Households in Pakistan spend their earnings on a variety of items to attain a certain level of utility. Household’s consumption behaviour is therefore an important aspect to be consider while analyzing food consumption patterns. Keeping in view the importance of food consumption in the economy the main aim of this paper is to analyze food consumption pattern of rural and urban households in Pakistan for aggregated food groups based on the HIES 2011-12 data using the Linear Approximate Almost Ideal Demand System (LA/AIDS) developed by Deaton and Muellbauer (1980a) and (1980b). The parameter estimated from the LA/AIDS model are used to calculate compensated, uncompensated and expenditures elasticities.
The remainder of this paper is organized into four sections. Theoretical modelling and data used to estimate compensated, uncompensated and expenditures elasticities is discussed in section 2. Section 3 comprise the empirical results and the last section presents the conclusion and policy recommendations.
Theoretical Modelling and Data
We estimated compensated and uncompensated own and cross price and expenditures elasticities by using the estimated coefficients from the Linear Approximate Almost Ideal Demand System (LA/AIDS) model. The LA/AIDS provide the first order approximation to the expenditures functions and satisfies the axioms of consumer choices and allows for investigating interdependence among products (Bryne et al., 1996).
Specification and Estimation of the LA/AIDS
Deaton and Muellbauer (1980a) and (1980b) derived the LA/AIDS from a flexible expenditure function with Price Independent Generalized Logarithmic preference to derive that is extremely useful for estimating a demand system with many desirable properties. The AIDS model automatically satisfies the aggregation restriction and with simple parametric restrictions, homogeneity and symmetry can be imposed. The LA/AIDS system in its budget share form is given as:
 Where;
 ,
,  and
and  are the parameters that need to be estimated.
  is the budget share of good i,
  is the price of good j and x is the total expenditure. P is the aggregate price index approximated by Laspeyres Price Index that is defined by
  , n is the number of goods, ln is the natural logarithm. Where;
 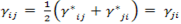 for two goods i and j. Separability is imposed at the food level, implying that consumers modify their optimal food consumption bundle when relative prices of individual foods change, given an optimal allocation of expenditure on food. Due to separability, the marginal rate of substitution between any food items is independent of the changes in the non-food items. Hence, the individual food price changes influence non-food consumption expenditures only through their influence on the allocation of total expenditures to food and non-food. The advantage of separability lies in the fact that at each stage of budgeting, information appropriate to the stage is required.
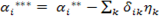
To account for the household characteristics, equation (1) is augmented with household specific socioeconomic, demographic, and regional characteristics, using the following relationship proposed by Pollak and Wales (1981):

Where;
 is a matrix of socioeconomic variables, and
  is the vector of parameters. The socioeconomic variables include household size measured as the number of household members; a binary variable for marital status of the household; and regional dummies representing the urban and rural region. Binary variables are equal to 1 when the phenomenon exists and 0 otherwise (for example, marital status equals 1 when the household is married, otherwise it is 0).
In this study, socioeconomic, demographic and regional characteristics included in Equation 1 as follows:
 (3)
(3)
Where;
 The demographic and dummy variables used in the complete demand system are the same as the ones used in single equation models.
Equation 3 is estimated for urban and rural regions of Pakistan. The budget shares and the price included in equation 3 are for fourteen food groups: milk, meat, fruits, vegetables, beverages, sugar, wheat and wheat flour, rice, other cereals, pulses, oil and fats, tea and coffee, backed products and other food.
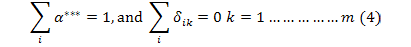
The theoretical restrictions i.e. adding up, homogeneity and symmetry imposed during the estimation process is as follow:
To estimate the system of equation in per capita terms the seemingly unrelated regression estimation method of Zellner (1963) is employed. Using the delta method the statistical significance of the estimated elasticities is employed. If a surveyed household does not consume a commodity, then the price for that commodity is missing; to keep these (missing) observations in the analysis, missing prices are replaced by average prices (Cox and Wohlgenant, 1986). Imposing the property of additivity of the expenditure function makes the variance and covariance matrix singular; thus, one of the equations needs to be omitted to estimate the LA-AIDS. The expenditure equation for “other food” is omitted, and the coefficients for the omitted equation are derived using the theoretical conditions imposed on the estimation process. However, the coefficients estimated using LA-AIDS are invariant to the omitted equation.
Demand Elasticities for the LA/AIDS Model
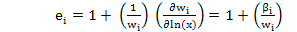
The elasticity derivations for the LA/AIDS models are widely investigated and well documented. Following Buse (1994) and Green and Alston (1990), taking the derivative of equation 3 with respect to ln(x), the expenditure elasticity  can be obtained as follows:
 (5)
(5)
Taking the derivative with respect to ln (pj), uncompensated own- (j = i) and cross- (j ≠ i) price elasticities,  , become as follows:
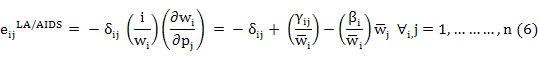
Where;
 is the Kronecker delta that is unity if i = j, and zero otherwise.
The Hicksian compensated price elasticities can be derived for the LA/AIDS model. The compensated price elasticities,  , become as follows:

Results
This section presents and discusses the results from the LA/AIDS model estimation for the selected food groups’ budget shares. The empirical result from the Seemingly Unrelated Regression of the specified demand function show that all estimated coefficients agree with a priori theoretical expectation. Estimates of the structural parameters for the LA/AIDS model are shown in Table 1 and 2. The parameters satisfy the adding up, homogeneity and symmetry restrictions. Overall it can also be seen from the estimated results that a reasonable number of coefficients of the explanatory variables are significant at the 99 percent level of significance.
Total Food Expenditures
As indicated by the estimated food total expenditures coefficients for urban and rural regions in Table 1 and 2. The total food expenditure is positively and significantly related to expenditures shares on all categories of food. A food expenditure coefficient represents 100 percent times the effect on a budget share of a 1 percent increase in total food expenditures. Table 1 and 2 shows the estimated coefficient for total food expenditures for urban and rural areas are highest for wheat and wheat flour (0.0431 and 0.0532) followed by milk (0.0228 and 0.0415), respectively. Assuming price constant, the result suggested that wheat and wheat flour and milk are comparatively more preferred at higher income level. The food budget share of milk, meat, fruits, vegetables, rice, other cereals, backed products and other food increase by 0.04159, 0.00971, 0.0012, 0.0002, 0.0145, 0.0201, 0.0013 and 0.0109 with a 1 percent increase in the food expenditures in rural region.
Price Variables
Own Prices: As indicated by the results in Table 1 and 2, the estimated own price coefficients for all food groups are significant except fruits in urban region. The own price coefficients represents 100 times the effect on the budget share of a 1 percent increase in the own price. The highest positive and significant value of wheat and wheat flour (0.102) followed by milk (0.0148) in rural region, while wheat and wheat flour (0.0786) followed by rice (0.0140) in urban region indicates that these are the most sensitive to price change. While the negative coefficients of milk, fruits, tea and coffee, backed products and other food in urban area and milk, sugar, sugar, tea and coffee, backed products and other food in rural areas indicates that its budget share decreases as own prices increases.
Cross Price: Table 1 and 2 shows the cross price effects for urban and rural regions of Pakistan. The estimated cross price coefficients indicates that the price of milk is significantly related to meat, fruits, vegetables, sugar, beverages, cereals, pulses, oil and fats, tea and coffee, backed products and other food budget shares and vice versa except fruits in urban region. For rural region the positive coefficients of milk price for of meat, fruits, vegetables, rice, other cereals, pulses, oil and fats, tea and coffee and backed products implies that their budget share will increase by 0.0013, 0.0012, 0.0022, 0.0053, 0.0092, 0.0005, 0.0037, 0.0026 and 0.0174, respectively, if the price of milk increase by 1%. In rural region, the highest value of wheat and wheat flour indicates its budget allocation is most sensitive to change in milk price as compared to urban region.
The estimated coefficients for both the regions shows that the price of meat are significantly related to all food categories except fruits and backed products in urban region. The highest positive coefficient for wheat and wheat flour (0.0064) in urban region indicated that its expenditure share is most sensitive while the lowest value of fruits (0.0003) is the least responsive to meat prices in urban region. Except meat in urban region and sugar and tea and coffee in rural region the results show significant relationship between the price of fruits and the budget shares of all food commodities as indicated by their estimated cross price coefficients. Significant (except backed product in urban region) relation is also found between the prices of vegetables and the budget shares of all food categories for both regions. Pulses and tea and coffee in urban region while sugar and tea and coffee in rural regions are having positive coefficients. The highest values of wheat and wheat flour (0.0150) indicates that it is the most sensitive to change in vegetables price.
Table 1 and 2 also show significant relation between the price of sugar and the budget shares of all other
Source: Author’s calculations form HIES, 2011-12; ***: Indicates significant at 99%; **: Significant 95%; *: Significant at 90%
Source: Author’s calculations form HIES, 2011-12; ***: Indicates significant at 99%; **: Significant 95%; *: Significant at 90%
food commodities. The sign of the estimated coefficient are positive for fruits, vegetables, rice, pulses, oil and fats, tea and coffee backed products and other food indicate that their budget share will increased in rural region by 0.0001, 0.0020, 0.0037, 0.0014, 0.00023, 0.0034, 0.0007 and 0.0180 percent, respectively with a 1 percent increase in sugar price. As indicated by the cross price coefficients the price of beverages is having significant relation with the budget shares of all food groups in both regions except backed products in rural region. The budget shares of meat in urban region and fruits, beverages and other food in rural region is having insignificant relation with the prices of wheat and wheat flour. The negative coefficients of vegetables, beverages, wheat and wheat flour, oil and fats, tea and coffee, backed products and other food implies that their budget shares decrease with increase in the price of rice in rural region. Pulses and backed product are having insignificant relation with the price of rice in rural region.
As indicated by the estimated cross price coefficients, the price of oil and fats significantly related to budget shares of food groups except pulses and backed products in rural region and backed product in urban region. The positive coefficient of fruits, vegetables, sugar and wheat and wheat flour in both the regions indicates that its budget share will increase with increase in the prices of pulses. The highest value of oil and fats in both regions show that its budget share is most sensitive to prices of tea and coffee. Beverages, rice, pulses and oil and fats in rural region while milk, meat, vegetables and pulses are having insignificant relation with backed product prices.
Demographic and Dummy Variables
The demographic variable included in the model show significant differences in the consumption patterns between urban and rural regions. Similar to the findings of Haq et al. (2011), Malik et al. (2014) and Ahmed et al. (2015) the results indicate that with an increase in the age, household consume more of meat, fruit, pulses, tea and coffee, backed products and other food in both the regions. No significant difference is found on the expenditures share of milk, fruits, sugar, wheat and wheat flour, pulses oil and fats, tea and coffee and backed products between rural married and unmarried households. Results show a significant increase in the consumption of vegetables, sugar, wheat and wheat flour, rice, oil and fats, pulses, tea and coffee and other food with the addition of individuals in the family in both regions.
Uncompensated and Compensated Own and Cross Price Elasticities
The uncompensated demand for most of food product, except milk, fruits, sugar, rice, tea and coffee backed products and other food in urban region and milk, sugar, rice, tea and coffee and backed products in rural regions is own price inelastic as reported in Table 3. The estimated elasticities are statistically significant and have the expected signs. The compensated demand own price elasticities are less than uncompensated demand own price elasticities indicates that all food commodities are normal goods. These elasticities shows the responsiveness to prices and determine the consumption patterns of households in rural and urban regions of Pakistan. The uncompensated demand for most of the commodities, except milk, rice, tea and coffee and backed product are price inelastic and the elasticities range varies from 0.347 (pulses) to 0.985 (other products). Pulses with price elasticity of 0.347 appeared to be least responsive to price change in rural region. The uncompensated demand own price elasticities of milk, sugar, rice, tea and coffee and backed products in more than unity indicating that rural households are much responsive to price change. However rural and urban disaggregation show that fruits were inelastic for rural region however highly elastic for urban region. The own price elasticities (except milk, fruits, sugar, rice, tea and coffee, backed products and other food) for urban region ranges from 0.338 for oil and fats to 0.971 for wheat and wheat flour which confirm that household in urban region have high income as compared to rural region.
A considerable difference between the compensated and uncompensated elasticities for urban region is found for most of the product like milk (0.839-1.032), meat (0.723-0.847), fruits (0.965-1.006), sugar (0.985-1.046), rice (0.650-1.017) and pulses (0.588-0.616) for urban region. While the difference between uncompensated and compensated own price elasticities are quite high in rural region as compared to urban region for majority of the products like milk (0.920-1.130), meat (0.768-0.860), sugar (0.961-1.023), wheat and wheat flour (0.291-0.949), rice (0.700-1.012), oils and fat (0.231-0.347) and backed products (0.996-0.014).
Out of 182 uncompensated cross price elasticities for
Source: Author’s calculations form HIES, 2011-12; ***: Indicates significant at 99%; **: significant 95%; *: significant at 90%
Source: Author’s calculations form HIES, 2011-12; ***: Indicates significant at 99%; **: significant 95%; *: significant at 90%
rural region 150 are negative (gross complements) and 32 are positive (gross substitutes). The number of net complements equals 8 and net substitutes 174 based on the compensated cross price elasticities. For urban region out of 182 uncompensated cross price elasticities 149 are negative (gross complements) and 33 are positive (gross substitutes). The number of net complements equals 15 and net substitutes 167 based on the compensated cross price elasticities. We found that most of the cross price elasticities are significant at 99 percent level of significance and our results are in line with those found by Haq et al. (2011), Nazli et al. (2012) and Ahmed et al. (2015) and contrary to Farooq et al. (1999).
Expenditures Elasticities
The estimated elasticities for individual food items provide useful insights into the consumption level. Base on the estimated expenditures elasticities for both the regions, the food commodities can be categorized into necessities and luxuries. Food groups having food expenditure elasticities equal to or less than “1” is considered as necessities and greater then unity for luxuries. On the basis of estimated expenditure elasticities urban and rural households’ in Pakistan exhibits different consumption pattern under different food expenditures (income levels). The households alter their consumption pattern in response to change in income. The food expenditure elasticities of different food groups consumed by urban and rural households are presented in Table 5. Results show that all the food groups, in both regions, have expected positive signs and ranges from zero to one except milk, meat, rice, other cereals, backed products and other food. In urban region, the expenditures elasticities for vegetables (0.900), sugar (0.948), wheat and wheat flour (0.750), pulses (0.839), oil and fats (0.832) and tea and coffee (0.997) reflects that these food items are considered necessities while milk (1.134), meat (1.203), fruits (1.143), other cereals (1.657), backed products (1.248) and other food (1.190) are the most responsive to changes in prices and therefore regarded as luxuries. These results are consistent with the findings of Haq et al. (2008), Malik et al. (2014) and Ahmad et al. (2015).
The analysis further reveals that all the elasticities are significantly different from zero and have the expected positive sign for rural household. Milk, meat, beverages, rice, other cereals, tea and coffee, backed products and other food can be regarded as luxuries as their expenditures elasticities are 1.247, 1.118, 1.004, 1.283, 1.585, 1.012, 1.080 and 1.05 respectively. These estimated expenditures elasticities portray that the demand for these food groups has the strongest income effect than other food groups. Vegetables, sugar, fruits, wheat and wheat flour, pulses and oil and fats can be regarded as necessities with their expenditures elasticities of 0.620, 0.879, 0.604, 0.739, 0.921 and 0.911, respectively. These analysis clearly indicates that an increase in income results in higher demand for expensive food items for both urban and rural regions of Pakistan. A closer observation from the Table 5 depicts that fruits are considered as luxury food items in urban region however this food item falls in the necessity food items group for rural households. One possible explanation for this may be the fact that fruits mostly come from the rural orchards where the prices are relatively low compared to urban regions where its higher prices hinder low income groups from its consumption. The above results confirms and agrees with the results of Haq et al. (2011), Nazli et al. (2012) and Ahmed et al. (2015).
Table 5: Expenditures elasticities for urban and rural regions, 2011-12
| Variables | Urban Region | Rural Region |
| Milk | 1.134*** | 1.247*** |
| Meat | 1.203*** | 1.118*** |
| Vegetables | 0.900*** | 0.620*** |
| Sugar | 0.948*** | 0.879*** |
| Fruits | 1.143*** | 0.604*** |
| Beverages | 0.781*** | 1.004*** |
| Wheat | 0.750*** | 0.739*** |
| Rice | 1.124*** | 1.283*** |
| Other Cereals | 1.657*** | 1.585*** |
| Pulses | 0.839*** | 0.921*** |
| Oils and Fats | 0.832*** | 0.911*** |
| Tea and Coffee | 0.997*** | 1.012*** |
| Backed Products | 1.248** | 1.080*** |
| Other Food | 1.190*** | 1.050*** |
Source: Author’s calculations form HIES, 2011-12; ***: Indicates significant at 99%; **: significant 95%; *: significant at 90%
Conclusion and Recommendations
LA/AIDS model is used in this paper to examine the food demand patterns of the urban and rural household. Regression analysis results reveal that own price, cross price and household’s food expenditures have significant effect on demand for all food groups. Socioeconomic and demographic factors included in the model have important influence on household food demand.
Sensitivity analysis show that the demand for most of food product except milk, fruits, sugar, rice, tea and coffee backed products and other food in urban region and milk, sugar, rice, tea and coffee and backed products in rural regions are less than unit elastic to own price. All the food groups, in both regions, have expected expenditures elasticities with positive sign and ranges from zero to one except milk, meat, rice, other cereals, backed products and other food.
The results of this paper has important policy implications. Prices of basic food items such as milk, meat, rice, other cereals, backed products and other food should be kept constant. Imposition of any sale tax could create huge loss in consumption for these commodities. Any increase in prices of these commodities should be backed with price subsidization policies. The uncompensated demand for milk, sugar, rice and backed products are own price elastic both in rural and urban regions, while the uncompensated own price wheat and wheat flour is inelastic. The uncompensated demand for milk, meat, rice, other cereals, backed products and other food are more elastic to food expenditures both in urban and rural regions and can be categorized as luxury goods. Beverages and tea and coffee are more elastic to total food expenditures in rural while fruits are more elastic in urban region. As the demand for milk, meat, rice, other cereals and other food products are more elastic to total food expenditures (income) both in rural and urban regions. Imposition of income tax in rural and urban low and middle income household could result in huge decrease in the expenditures on these commodities.
Acknowledgments
This Paper is financed by Higher Education Commission of Pakistan.
Conflict of Interest
No conflict of Interest.
Authors’ Contribution
Principal Author is a PhD scholar and this article is a part of his PhD dissertation. Second Author is Major Supervisor of the PhD scholar.
References
Ahmad, N., M.R. Shaikh and K. Shaik. 2015. Rural urban food consumption analysis in Pakistan: Expenditure elasticities approach. Pak J. Commerce Social Science. 9(1): 159-170.
Buse, A. 1994. Evaluating the almost ideal demand system. Am. J. Agric. Econ. 76(4): 781-793. http://dx.doi.org/10.2307/1243739
Byrne, P., O. Capps and A. Shaha. 1996. Analysis of food-away-from-home expenditure patterns for US households, 1982-89. Am. J. of Agric. Econ. 78: 614-627. http://dx.doi.org/10.2307/1243279
Burki, A.A. 1997. Estimating consumer preferences for food, using time series data of Pakistan. The Pakistan Develop. Rev. 36(2): 131-153.
Cox, L., and K. Wohlgenant. 1986. Prices and quality effects in cross-sectional demand analysis. Am. J. Agric. Econ. 68: 908-919. http://dx.doi.org/10.2307/1242137
Deaton, A., and L. Muellbauer. 1980a. An Almost Ideal Demand System. Am. Econ. Rev. 70: 312-26.
Deaton, A., and L. Muellbauer. 1980b. Economics and consumer behaviour. Cambridge University Press, Cambridge, UK. http://dx.doi.org/10.1017/CBO9780511805653
FAO, IFAD and WFP. 2013. The state of food insecurity in the World 2013. The multiple dimensions of food security, Rome, FAO.
Farooq, U., T. Young and M. Iqbal. 1999. An investigation into the farm households consumption patterns in Punjab, Pakistan. Pakistan Develop. Rev. 38(3): 293–305.
Food and Agriculture Organization (FAO). 2011. Food balance sheets. Food and Agriculture Organization. Available at: http://faostat.fao.org/site/368/default.aspx.
Green, R., and J.M. Alston. 1990. Elasticities in AIDS model. Am. J. Agric. Econ. 72(2): 442-445. http://dx.doi.org/10.2307/1242346
Government of Pakistan. 2015. Household integrated economic survey. Pakistan Bureau of Statistics, Islamabad. http://www.pbs.gov.pk/content/pakistan-social-andliving-standards-measurement.
Haq, Z., H. Nazli, K. Meilke, M. Ishaq, A. Khattak, A.H. Hashmi and F.U. Rahman. 2011. Food demand patterns in Pakistani Punjab. Sarhad J. Agric. 27(2): 305-311.
Haq, Z., H. Nazli and K. Meilke. 2008. Implications of high food prices for poverty in Pakistan. Agric. Econ. 39: 477–484. http://dx.doi.org/10.1111/j.1574-0862.2008.00353.x
Haq, Z., and J. Cranfield. 2011. Household food demand in Pakistan: Does demand specification matter? Afr. J. Business Manage. 5(17). http://www.academicjournals.org/AJBM
Malik, S.J., H. Nazli and W. Edward. 2014. The official estimates of poverty in Pakistan – what is wrong and why? – Illustrations using the Government of Pakistan’s Household Integrated Economic Survey 2010-11. PSSP Working Paper (forthcoming), Pakistan Strategy Support Program of International Food Policy Research Institute, Islamabad.
Nazli, H., H.S. Haider and A. Tariq. 2012. Supply and demand for cereals in Pakistan, 2010-2030. Pakistan Strategy Support Program. E-copy available at: http://ssrn.com/abstract=2185441.
Pollack, A. and J. Wales. 1981. Estimation of complete demand systems from household budget data: The linear and quadratic expenditure systems. Am. Econ. Rev. 68:348-359.
Zellner, A. 1963. Estimators of seemingly unrelated regression: Some exact finite sample results. J. Am. Stat. Ass. 58: 977-992. http://dx.doi.org/10.1080/01621459.1963.10480681
To share on other social networks, click on any share button. What are these?


