
An Empirical Analysis of Battambang Agricultural Cooperatives Efficiency in Cambodia


Research Article
Po Bunnika, Khalid Khan and Guo Xiangyu*
College of Economics and Management, Northeast Agricultural University, Harbin, Heilongjiang 150030, China.
Abstract | This study estimates the expediency of Technical Efficiency (TE), Allocative Efficiency (AE), Overall Efficiency (OE) and Scale Efficiency (SE) for 183 cooperatives in Battambang, Cambodia. Typically, each cooperative is well-organized vis-à-vis TE, AE, and OE correspondingly. The results of the study indicated that around 66.77%, 20.20%, and 13.11% of the cooperatives are functioning under the increasing, constant and decreasing return to scales, respectively. As a result, a cooperative tend to cut costs by concentrating on TE, AE, and OE instead of lowering costs. Furthermore, the study has introduced the ordinary least squares (OLS) model to examine the relationship between profitability ratios and performance measures, which indicates that return on assets and equity are linked to technical and distribution efficiency. The cooperatives could increase their profits by upsurging sales performance instead of improving technical performance. These results also confirm that cooperatives managers should give greater importance to the effective use of capital and labor by increasing agricultural output.
Received | April 11, 2019; Accepted | September 23, 2019; Published | November 07, 2019
*Correspondence | Guo Xiangyu, College of Economics and Management, Northeast Agricultural University, Harbin, Heilongjiang 150030, China; Email: guoxy@neau.edu
Citation | Bunnika, P., K. Khan and G. Xiangyu. 2019. An empirical analysis of battambang agricultural cooperatives efficiency in Cambodia. Sarhad Journal of Agriculture, 35(4): 1094.1098.
DOI | http://dx.doi.org/10.17582/journal.sja/2019/35.4.1094.1098
Keywords | Technical Efficiency, Allocative Efficiency, Cambodia, Overall Efficiency, Agricultural output
Introduction
The agricultural cooperatives primarly established to take into account the common needs of the households by the ensuing principle of equality and fairness, based on self-support with the objective to overwhelm the hardness of life. Furthermore, cooperatives strive to cut the cost of production to a significant level, strengthen market competitiveness and improve varied kinds of efficiencies in the production processes. Agricultural cooperatives anticipate that through the cooperation of the members, resources can be utilized efficiently to create comparative advantages and achieve a common goal. Subsequently, it is very important for cooperatives to attain all kinds of efficiencies (Technical Efficiency (TE), Allocative Efficiency (AE), Overall Efficiency (OE) and Scale Efficiency (SE)), as efficiencies have a direct impact on agricultural production and distribution of income among the farmers. Therefore, it is vital for agricultural cooperatives to expand and achieve all kinds of efficiencies by working effectively. Generally, it is easy to estimate the technical relationship between inputs and outputs for profit-oriented organizations. However in the case of non-profit organizations, to estimate such sort of relationship is always challenging , as a non-profit organization has different standards and criteria which are difficult to quantify. In case of non-profit organizations, the technical relationship between inputs and outputs is not much significant as the ultimate objective of the organization is social benefit and coherence.
Presently, there are 183 agricultural cooperatives in the Battambang Province, Cambodia. However, some of the agricultural cooperatives are most efficient, but it is imperative to bring both inefficient and efficient cooperatives under discussion for the sake of comprehensive understanding. Agricultural cooperatives are one of the core agricultural communities of the farmers in Battambang, where members are striving hard for the greatest economic benefits in agricultural production and sales. Additionally, the cooperatives playing a major role in the promotion of agricultural development, rural prosperity and improving the standard of lives of farmers. Nevertheless, presently in Cambodia agricultural cooperatives are facing widerange problems e.g. scarace resources, shortage of technical personnel in management, , lack of awareness and training, an indecorous regulation system and absence of an appropriate policy for cooperatives. For the same reason, the function of the cooperatives is not ascertained and less effective in Cambodia. In this regard, researchers and policymakers are engaged to conduct and deliberate some relevant research on the agricultural cooperatives in Cambodia.
Dong (2010) investigated the efficiency of agricultural cooperatives based on the four factors: wages, capital, size of the community and social protection. Xu et al. (2011) specified that the scale of agricultural cooperatives affects operational efficiency. Xu (2010) has documented that the social cohesion of agricultural cooperatives has double outcomes: economical and ethical. The economic value is associated with production, selling of goods and services while the ethical aspect is linked with the principles of agricultural cooperatives. Zeng and Zhang (2011) highlighted that a suitable and effective management system in agricultural cooperatives is more effective and efficient, to get the maximum profit. Nevertheless, the aforementioned studies only discussed the valuation factors which are responsible for the technical and operational efficiency of agricultural cooperatives. However, this paper has estimated all kinds of efficiencies (TE, AE, OE and SE) for the Battambang cooperatives by applying the most appropriate Data Envelopment Analysis (DEA) model. Henceforward, in this study is carried out the analysis by using more comprehensive and updated data and put forth some useful policy implications for the development of cooperatives. In order to depict the meticulous relationship between inputs and outputs in cooperatives, it is imperative to study the various kind of efficiencies. Consequently, the objective of this study is to comprehend and asses the TE, AE, OE, and SE of agricultural cooperatives in Battambang. The rest of the study is organized as follow; the next section offers research methodology while the upcoming two sections offer results and discussionand conclusion of the study, respectively.
Materials and Methods
This study has applied secondary data, extracted from the Annual Books of Cooperative and Balance Sheet of Cooperative of the Battambang province, Cambodia spanning over the period 2013-18. The cooperative of Cambodia is involved in the production of crops, fruits, services, fisheries, livestock, agrochemicals, food products and to provide different types of services to the farmers. Moreover, the complete balance sheet and income statement consist of audited financial statements which are extracted from the Department of Agricultural Cooperatives Promotion (DACP). Moreover, in total there are 183 cooperatives in the Province are included in our study. All the variables are in nominal form, therefore, formally to apply an appropriate econometrics technique , first, these are adjusted with Gross Domestic Product (GDP) deflator (the based year is 2010) Khan et al. (2018). The major outputs of the cooperatives are grain, fertilizers, agrochemicals, food products, and other products, while labor and capital (including management and staff) are the inputs
Econometrics model
The Data Envelopment Analysis (DEA) propounded by Charnes, Cooper and Rhodes in (1978) has been utilized for the empirical analysis. The purpose of the model is to estimate the relative effectiveness and efficiency of cooperatives in case of multiple inputs and outputs of non-profit organizations. The efficiency frontier is defined by the most efficient in multiple decision-making units and linked to actual effectiveness to determine the relative effectiveness of the DUM. If the efficiency score is at the frontier, then the cooperatives are relatively effective, otherwise comparatively inefficient. Henceforth, this study has considered the super-efficiency approach standard the assumption of input-oriented that DMU is SBM efficiency subject to the constraint of variable return scales. The setting of super-efficiency is deliberated under the assumption that DMU is the part of SBM-efficiency, i.e., it is anticipated that it will be pretty efficient.
Let the set of:
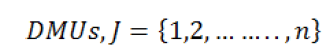
Whereas all DMU has ‘N’ input and ‘O’ outputs. Where in the vector of inputs and outputs for DMUj is considering:
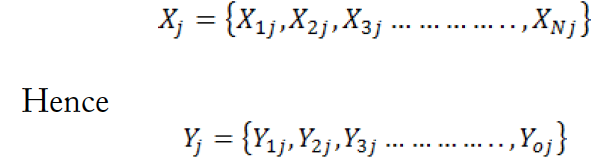
Furthermore, the Y and X can be defined as vectors of inputs and outputs matrices in the following forms:
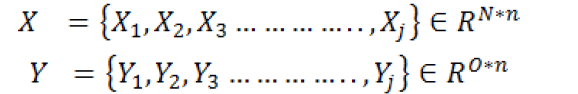
Henceforward, X > 0, and Y > 0. Afterwards, under a variable return to scale the set production function can be derived as follow:
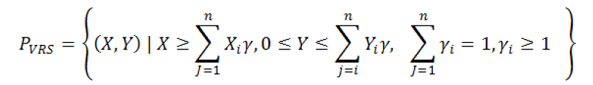
Whereas: γi = (γi γi γi……… γi), T =intensity vector. Therefore, the SBM-DEA model is considering the input-oriented for computing DMU, which is explained as under:
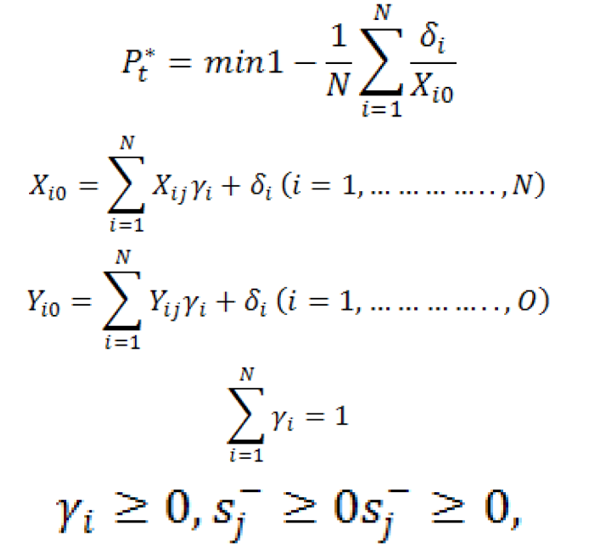
However, the unique Advanced Dea Models- Slack Based Models (SBM) model cannot deliver extra precise effectiveness appraisal. Therefore, following by Tone (2002) the mixture of both super-efficiency and SBM approaches have been hurled the Super-SBM model. This innovative modelis presented as under:
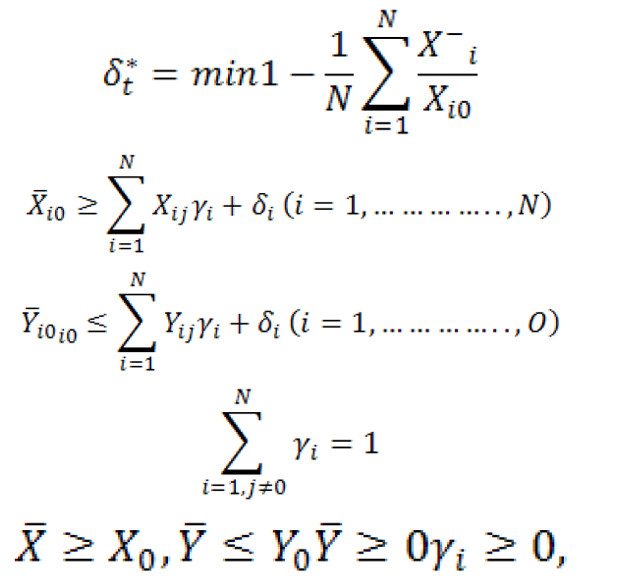
Hence, to estimate the exact efficiency values, under the Super-SBM model might be generated the efficiency value greater than 1. Although, setup of these econometrics models the constraint under VRS are below respectively.
Results and Discussion
Table 1 reports the results of the frequency distribution of inclusive efficiencies, and the entire efficiencies ranged between 0.20 to 1.00. The frequency distribution of efficiencies shows that overall efficeiency of 35.5% of cooperatives is between 0.20 to 0.60 while for the remaining 64.5% of cooperatives are the efficiency score lies in the range of 0.60 to 1. Similarly, the estimates of technical efficiency and allocative efficiency exhibit that 74.85% and 84.07% of cooperatives respectively are highly efficient as their efficiencies are in the range of 0.60 to 1. Likewise, in the case of seal efficiency, a significant number of cooperative i.e. 92.8% are extremely efficient. For efficiency score more than 0.60, the percentage score of OE, TE, AE, and SE cooperatives is 60 as 65.5, 74.85, 84.07, and 92.8 respectively.
Table 1: Results of the inclusive efficiencies.
|
Distribution |
OE |
TE |
AE |
SE |
|
0.2 < and <0.4 |
09 (4.9%) |
06(2.3%) |
05(2.7%) |
04(2.2%) |
|
0.4 < and < 0.6 |
56 (30.6%) |
40(21.9%) |
24(13.1%) |
09(4.9%) |
|
0.6 < and < 0.8 |
65(35.5%) |
73(39.9%) |
42(22.9%) |
65(35.5%) |
|
0.8 < and <1 |
30 (16.4%) |
50(27.3%) |
63(34.4%) |
56(30.6%) |
|
1 |
23(12.5%) |
14(7.6%) |
49(26.77%) |
49(26.7%) |
|
Total |
183(100%) |
183(100%) |
183(100%) |
183(100%) |
Whereas: (OE) Overall Efficiency, (TE)Technical Efficiency, (AE) Allocative Efficiency and (SE) Scale Efficiency.
Note: The detail of descriptive statistic is available in Supplementary Table 1
Table 2 presents the results of the return to scale competence. According to this analysis, 66.77% of cooperatives under the study are functioning subject to increasing returns to scale while 13.11% operating under decreasing returns to scale and the remaining 20.20% are working under constant returns to scale. The result suggests that a considerable number of cooperatives might be more efficient in adapting their scale and size, however, the cooperatives are more effective to reduce costs by focusing on technical and allocative efficiency rather than expansion.
Table 2: Return to scale condition of the cooperatives.
|
Returns to scale |
No. |
|
DRS |
24(13.11%) |
|
CRS |
37(20.20%) |
|
IRS |
122(66.77) |
|
Total |
183(100%) |
Whereas: Increasing to Return to Scale (IRS), Decreasing Return to Scale (SRS)and Constant Return to Scale (CRS).
In order to decompose the financial characteristics associated with inefficiency for this purpose, the OLS model is applied to establish the relationship among efficiency and return on assets and return on equity. Moreover, all of the variables are estimated in log form; therefore, estimates of the model can be interpreted directly as elasticity. The results of the OLS model are reported in Table 3 which exhibit that the relationship between seal efficiency and both returns on equity and return on assets are statistically insignificant. An upsurge in TE, AE, and OE by one percent, intensifies the return on assets by 0.3%, 14%, and 11%, respectively. Likewise, a rise in TE, AE, and OE by one percent, aggravates the return on equity by 0.2%, 0.3%, and 0.44%, respectively.
Table 3: The relationship between efficiency and profits.
|
Return on Assets |
Return on Equity |
|||
|
c |
RA |
Constant |
RE |
|
|
TE |
0.012* |
0.036*(0.012) |
0.001 |
0.0204*(0.010) |
|
AE |
0.096 |
0.144*(0.036) |
0.091* |
0.033* (-0.011) |
|
SE |
0.182* |
-0.041(-0.038) |
0.421 |
-0.0451(-0.0451) |
|
OE |
0.044 |
0.114*(-0.038) |
0.020 |
0.0442(-0.221) |
Whereas: (OE) Overall Efficiency, (TE)Technical Efficiency, (AE) Allocative Efficiency and (SE) Scale Efficiency. Standard Errors are in the parenthesis.
The return on assets and return on equity increased by 0.50% and 0.95% for a variation in the allocation efficiency by 0.1 unit. A unit increase in an allocation efficiency increased the profitability events more than the same technical increase efficiency.
Table 4 reports the results of TE, AE, SE, and OE to explain cost factors. The results show that the labor is tending underutilized while the capital is overutilized. A 10% reduction in capital costs would increase the technical efficiency by 5.3% but would reduce allocation efficiency and economies of scale by 1.6% and 0.4%, respectively. The elasticity of capital and labor costs based on technical allocation and overall efficiency benchmark. Increasing the workforce by 10% would increase technical efficiency by 6.29%, while reducing allocation and rising efficiency by 1.73% and 0.78%, respectively. Generally, a 10% reduction in capital costs would increase the overall efficiency by 3.2%, while an increase in labor costs by 10% would increase the overall efficiency by 3.9%.
Table 4: Relatioship between efficiencies indices and cost factors.
|
TE |
AE |
SE |
OE |
|
|
c |
10.95**(.023) |
-.421**(.082) |
0.132**(.039) |
0.231**(.201) |
|
Capital Cost |
-.419**(.019 |
.129*(.039) |
.050**(.010) |
-.400**(.071) |
|
Labor cost |
.131**(.01) |
-.133**(.05) |
-.066**(.023) |
.368**(.012) |
|
R2 |
0.72 |
0.50 |
0.60 |
0.67 |
|
Adj R2 |
0.70 |
0.48 |
0.59 |
0.65 |
|
F-Statistics =25.10 |
||||
|
DW=1.83 |
||||
Standard Errors (SE) are in parenthesis, (CC) Capital Cost, Standard Error.
Conclusions and Recommendations
This study quantifies the effectiveness of the TE, AE, SE, and OE for 183 cooperatives in Battambang, Cambodia. On the average, all cooperatives are efficient in terms of TE, AE, and OE respectively. The results show that cooperatives with values of 66.77%, 20.20%, and 13.11 % are operating under the increasing returns to scale, constant returns to scale and decreasing returns to scale. Therefore, a cooperative in Battambang tends to reduce costs by focusing on TE and AE rather than reducing costs. Moreover, the OLS model is applied to explain the relationship between efficiency indices and industry profitability ratios such as return on assets and return on equity. The return on assets and equity are positively associated with the technical and allocative efficiencies. A cooperative might upsurge its profits by refining allocative efficiency instead of improving technical efficiency at the same level. These results also confirm that optimal production technology and scale insufficient inputs are more important for determining the economic condition compared to non-optimal size. Further study focusing on productivity changes during this period could better explain yield differences between efficiency.
Novelty Statement
This study put forth some useful policy implications for the development of cooperatives. In order to depict the meticulous relationship between inputs and outputs in cooperatives, in this regard, the study is comprehended the Technical Efficiency (TE), Allocative Efficiency (AE), Overall Efficiency (OE) and Scale Efficiency (SE) of agricul-tural cooperatives in Battambang, Cambodia.
Author’s Contribution
Both Po Bunnika and Khalid Khan equally contributed to the manuscript under the supervision of Professor Dr. Guo Xiangyu.
Supplementary Material
There is supplementary material associated with this article. Access the material online at: http://dx.doi.org/10.17582/journal.sja/2019/35.4.1094.1098
References
Cai, R. and H. Han. 2011. The empirical analysis of influence costs determinants in cooperative: evidence from apple specialized cooperatives in Shandong province. Econ. Rev. 5: 106-112.
Charnes, A., B. Cooper, L. Golany and J. Stutz. 1985. Foundations of data envelopment analysis for pareto-koopmans efficient empirical production functions. J. Econ. 30(1/2): pp. 90-107. https://doi.org/10.1016/0304-4076(85)90133-2
Dong, X. 2010. Empirical research on the relationship between government support and farmer specialty cooperatives’ operating performance: based on the mediation of TMT’s collective innovation. Stat. Educ. 6: 33-37.
Golany, B. and Y. Roll. 1989. An application procedure for DEA. OMEGA, 17(3): 237-250. https://doi.org/10.1016/0305-0483(89)90029-7
Khan, K., G. Khan, M. Zahri and M. Altaf. 2015. Role of livestock in poverty reduction: A case study of district Lasbela, Balochistan. Lasbela, UJ Sci. Tech. pp. 153-156.
Khalil, J.K. 2007. Food security with special reference to Pakistan. Higher Educ. Comm.
Khan, K., M.A. Kamal, H. Zhao, A. Ullah and F. Saeed. 2018. Nexus between livestock ownership and food security: A case study of district Lasbela, Balochistan.
Khan, K., M.A. Kamal, S. Ramazan, G. Khan, G. Ali and S. Ahmed. 2018. Impact of agricultural credit on livestock income: A case study of District Lasbela, Balochistan. Sarhad J. Agric. 34(2): 246-250. https://doi.org/10.17582/journal.sja/2018/34.2.246.250
Li, F. and D. Zhang. 2011. The theoretical explanation of diversified development pattern of Chinese farmer professional cooperatives. Open Era, 19: 51-53.
Li, Z., Q. Liu, T. Mao and S. Che. 2010. Participation in agricultural cooperatives on the household income: as the Danyang City Dantu District a example. Rural Econ. Technol. 21(07): 52-53.
Lou, D. 2010. Empirical research on the relationship between government support and farmer specialty cooperatives’ operating performance: based on the mediation of TMT’s collective innovation. Stat. Educ. 12: 42-52.
Memon, M.H., K. Khan, M.Y. Abbass, G. Khan and M.A. Kamal. 2015. Impediments to technology adoption: a case study of peach production in district Swat, Pakistan. J. Manag. Sci. 9(2): 85-100.
Shaikh, S.A., O. Hongbing, K. Khan and M. Ahmed. 2016. Determinants of rice productivity: An analysis of Jaffarabad district–Balochistan (Pakistan). Eur. Sci. J. ESJ. 12(13): 41-50. https://doi.org/10.19044/esj.2016.v12n13p41
Tone, K. 2002. A slacks-based measure of efficiency in data envelopment analysis. Euro. J. Operat. Res. 130(3): 498-509.
Xu, F., L. Qiu and L. Xiao. 2011. Game analysis of the planting and breeding industry farmers’ professional cooperative subject relationship under the background of accelerating development in agriculture industrialization. J. Jiangxi Agric. Univ. 6: 31-35.
Xu, H. 2010. Analysis of the influencing factors of the farmer cooperatives rural human capital team’s formation-based on Hubei 173 family’s date of 5 city. Chinese Agric. Sci. Bull., 26(35): 342-346.
Zeng, M. and Z. Yang. 2011. Research on the benefit distribution model of farmers’ specialized cooperatives. East China Econ. Manage. 25(3): 68-70.
Zhang, X. 2011. The analysis of the factors impacting farmers dependence for professional cooperatives-based on the survey of 408 villages in 4 provinces including Shandong. Cent. Univ. Finance J. 1: 44-49.
Zhang, Y. 2011. The empirical analysis on the new agricultural cooperatives based on GIS. Agric. Res. 3: 7-11.
Zhanga, J. and K. Feng. 2010. A study on the influencing factors in agricultural integration conducted by farmer’s cooperatives.Tech. Econ. Manage. Stud. 3: 148-151.
To share on other social networks, click on any share button. What are these?


