

The Arabian Camel, Camelus dromedarius Interferon Alpha: Cloning, Expression in Escherichia coli, in vitro Refolding and Cytotoxicity on Triple Negative Breast Cancer Cell Line MDA-MB-231


The Arabian Camel, Camelus dromedarius Interferon Alpha: Cloning, Expression in Escherichia coli, in vitro Refolding and Cytotoxicity on Triple Negative Breast Cancer Cell Line MDA-MB-231
Hesham Saeed1*, Manal Abdel-Fattah1, Ahmad Eldoksh1, Farid S. Ataya2 and Manal Shalaby3
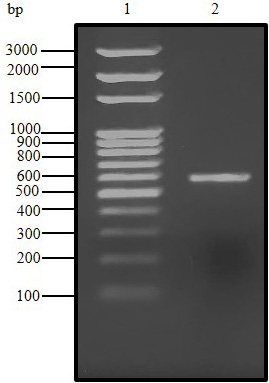
Agarose gel (1.5%) electrophoresis of PCR product for C. dromedarius IFNα gene (Lane 2). Lane 1 represents 100 base pair DNA ladder.

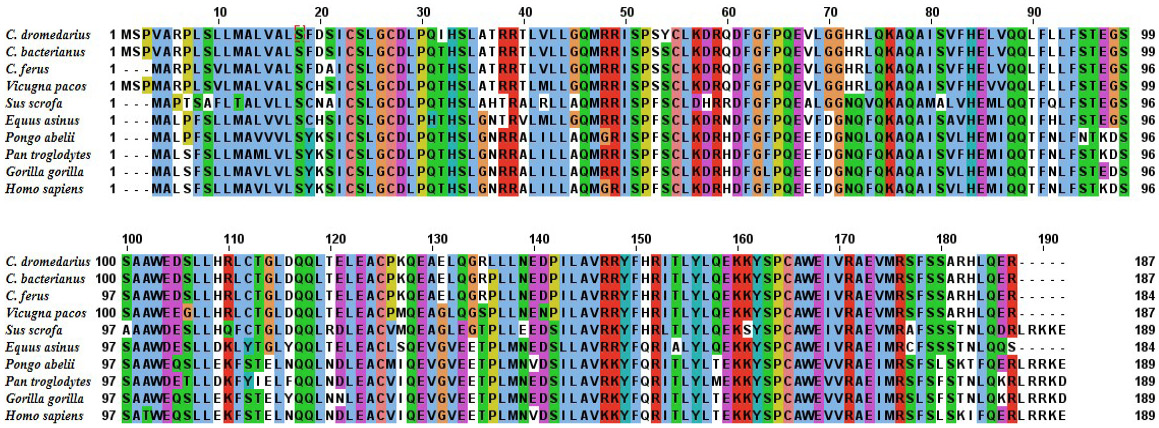
Alignment of the deduced amino acid sequence of C. dromedrius IFNα with IFNα from other species.
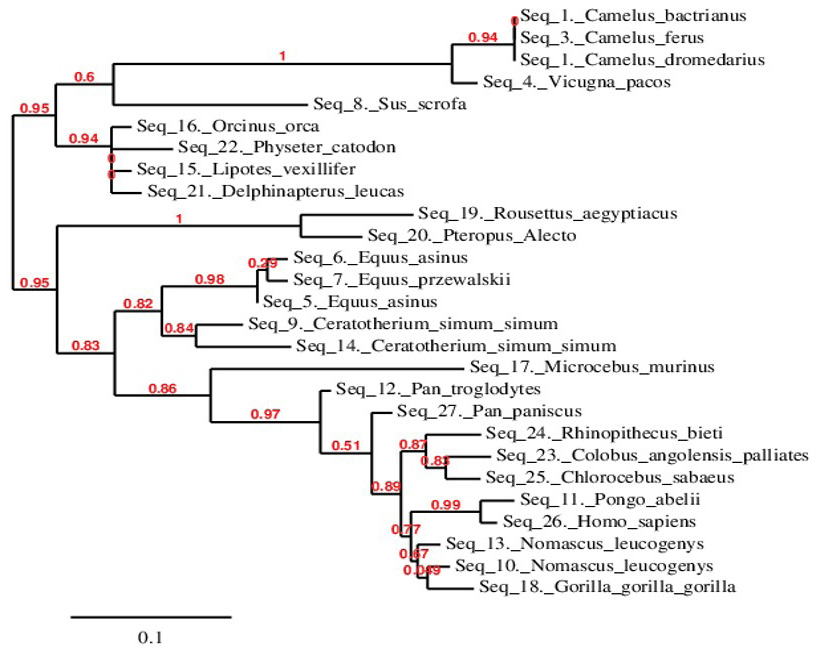
Phylogenetic relationship of C. dromedarius IFNα and sequences from other species. Maximum likelihood tree based on complete coding sequences deposited in GenBank. Values at nodes are bootstrap ≥ 50%, obtained from 1000 re-samplings of the data.
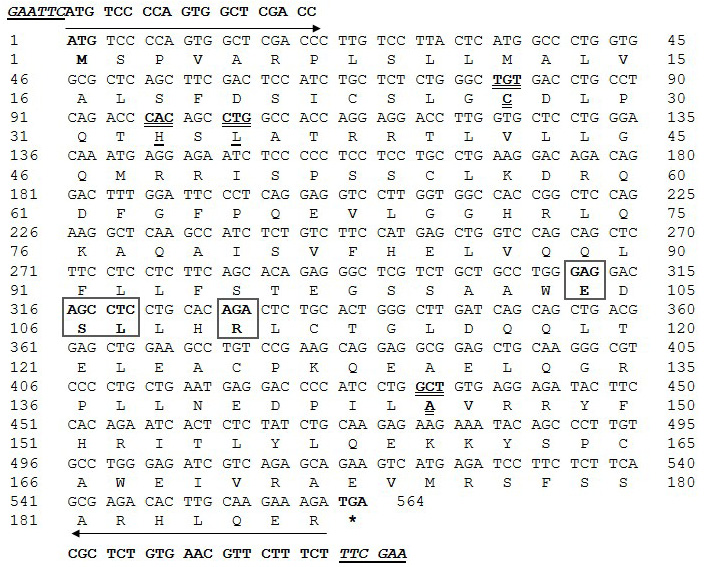
Nucleotide and deduced amino acid encoding region of C. dromedarius IFNα. Important amino acid residues and regions include: residues that may contact N-Acetyl-2-Deoxy- are indicated by the box; residues that may contact an SO4 ion are indicated in bold underline; residues that may contact Zn2+ are indicated by bold double underline, conserved amino acid residues in the IFNα protein are indicated by bold dashed underline, residues involved in IFNAR-1 binding are indicated with the circle, and residues involved in IFNAR-2 binding are indicated by the bold dashed box. Arrows indicate the location of the forward and reverse primers with restriction enzyme sites presented in bold underline italics.

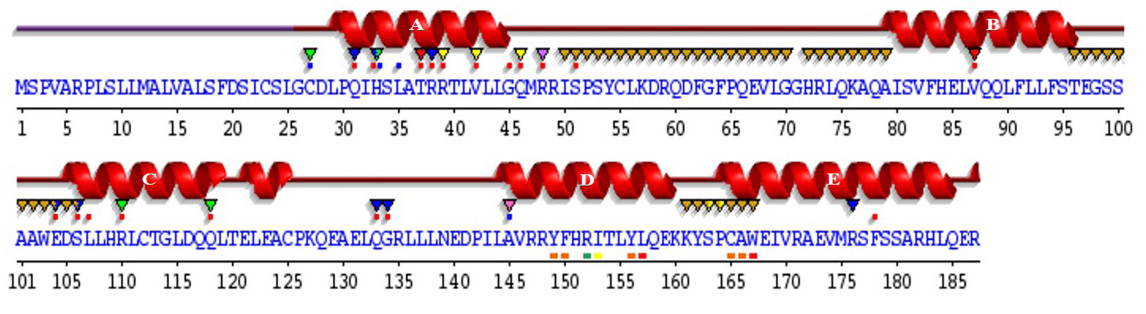
Sequence annotations for C. dromedarius IFNα showing the location of α-helices and residues contacting ligand and ions. Secondary structure by homology (), active site residues from PDB site record (▼); residues with contact to ligand (*) and to ions (*).

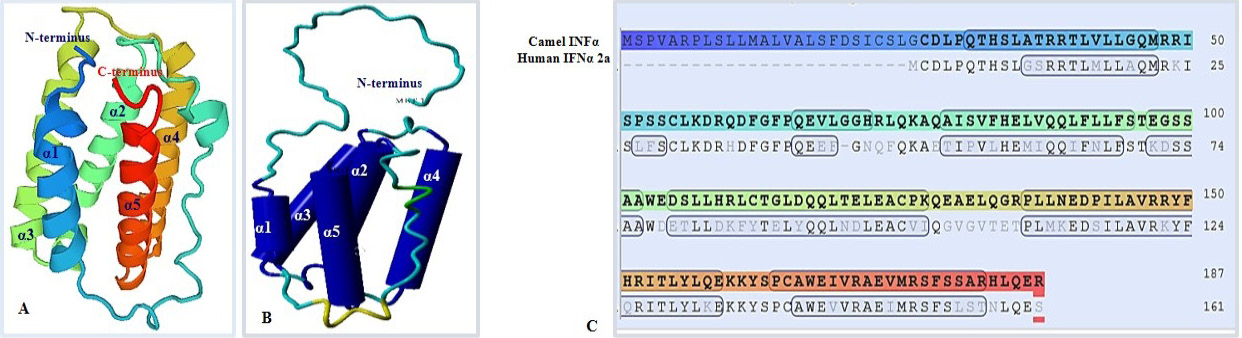
Predicted 3D structure of C. dromedarius IFNα protein shows the overall secondary structure in ribbon form (A) and cartoon form (B). Alpha helices are labeled from α1 to α5. (C) Model-template alignment of amino acid residues of C. dromedarius IFNα and Homo sapiens IFNα2a. Components of the secondary structure are shown in blue (α helices) and brown (coils). Identical amino acid residues are shown in bold black.
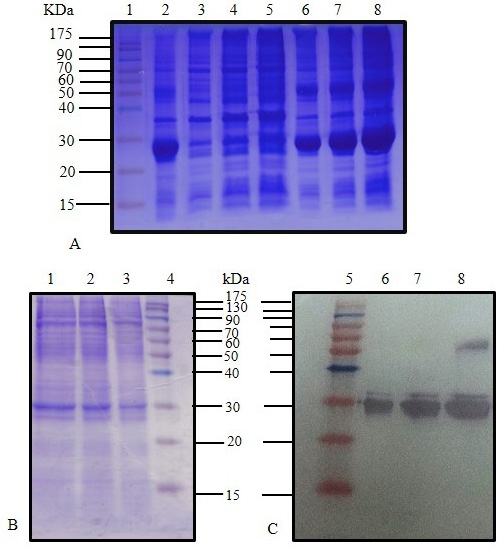
SDS-PAGE (12%) for IPTG induced E. coli BL21(DE3) pLysS pET28 a (+) harboring C. dromedarius IFNα cDNA (Lane 2), IPTG induced culture supernatant (Lanes 3-5), and IPTG induced culture inclusion bodies (Lanes 6-8). (B) SDS-PAGE (12%) for IPTG induced culture (Lanes 1-3) and western blotting analysis with 6x-His-Tag monoclonal antibody (1:1000 dilution) for IPTG induced culture (Lanes 6-8). Lanes 1 (Panel A), 4 (Panel B) and 5 (Panel C) represent pre-stained molecular weight protein markers.

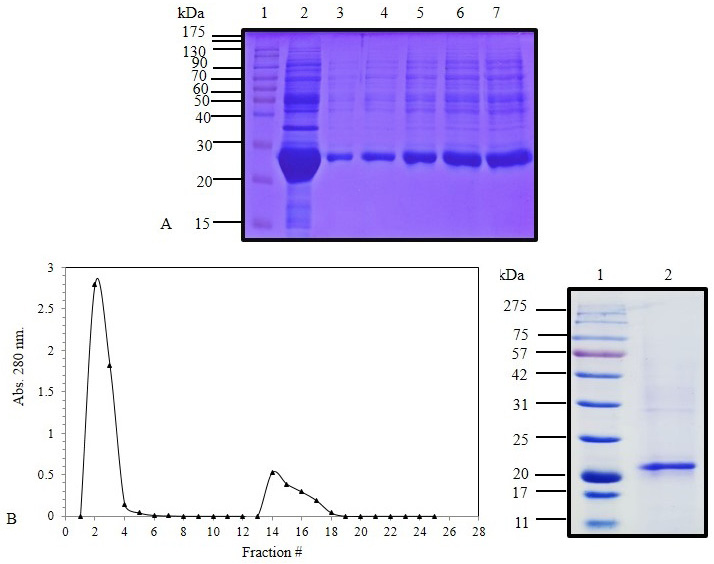
(A) SDS-PAGE (12%) for IPTG induced E. coli BL21(DE3) pLysS pET 28 a (+) harboring IFNα cDNA inclusion bodies protein (Lane 2) and solubilized IFNα inclusion bodies (Lanes 3-7). (B) Elution profile of C. dromedarius IFNα after nickel affinity chromatography. Column flow rate was adjusted to be 3 mL/5 min. (C) SDS-PAGE (12%) for nickel affinity purified camel IFNα protein (Lane 2). Lanes 1 in Panel A and B represent pre-stained molecular weight protein markers.

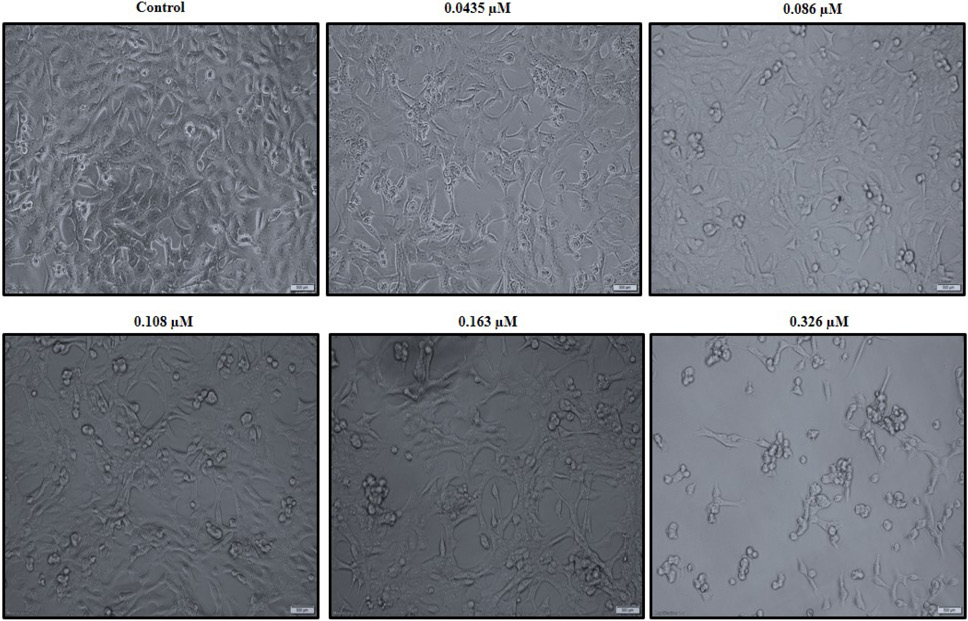
C. dromedarius IFNα alters the morphology of the MDA-MB-231 triple negative breast cancer cell line in a dose dependent manner. Cells were treated with varied concentrations of purified recombinant C. dromedarius IFNα (0.0435-0.326 µM) for 24 h. Cells exhibited morphological changes indicated by shrinkage, detachment from the substratum, and rounding up as the concentration of IFNα protein increased compared with that observed for the control untreated cells (C). Magnification was 40X.

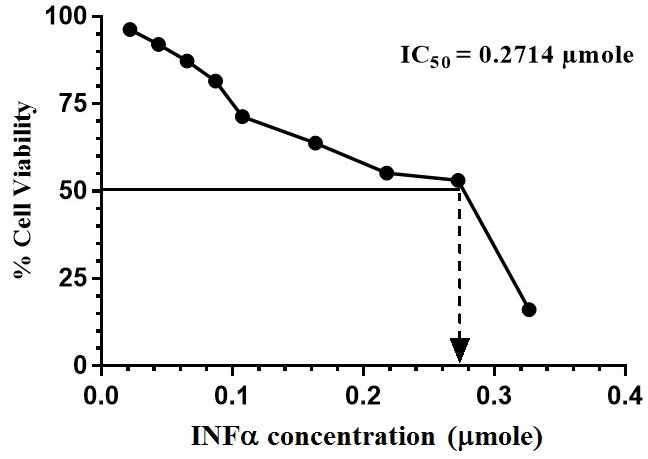
MTT assay was performed and the % cell viability was calculated compared to that of the control cells. GraphPad Prism 6 was used to calculate the IC50 of C. dromedarius IFNα protein.


