

Stock Evaluation of the Data-Limited Fisheries: A Case Study of Five Major Commercially Important Fishes from the Western Indian Ocean, Pakistan


Stock Evaluation of the Data-Limited Fisheries: A Case Study of Five Major Commercially Important Fishes from the Western Indian Ocean, Pakistan
Hasnain Raza1,2, Qun Liu1*, Muhammad Tariq Hanif2 and Yanan Han1

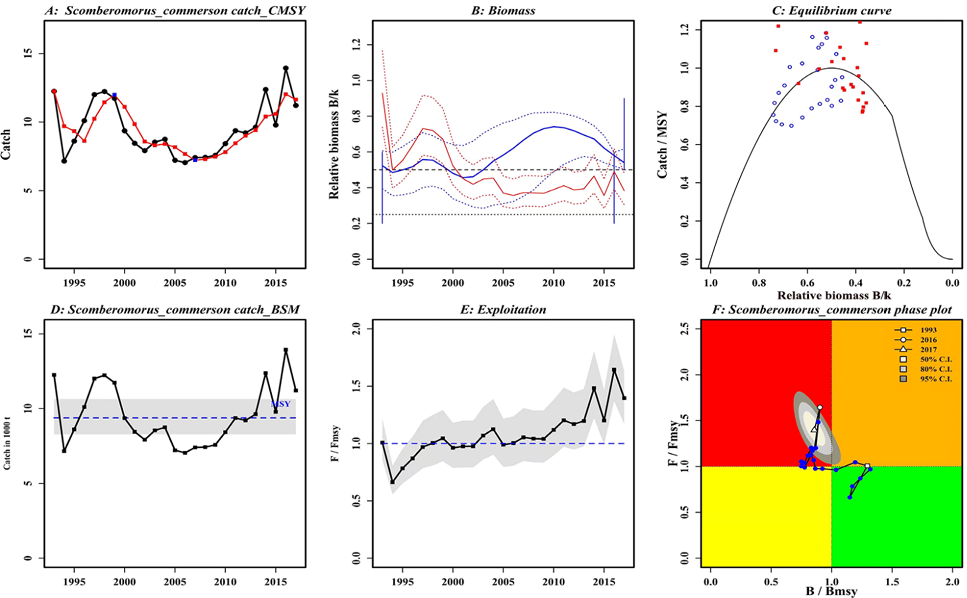
Estimated results of CMSY and BSM method for Somberomorus commerson (A) Time series of catch (black line) and moving average (red line) (B) Relative biomass estimated by CMSY (blue lines) and BSM (red lines) (C) curve estimated by CMSY (blue dots) and BSM (red dots) (D) Time series catch (E) Exploitation rate (F) Kobe plot of S. commerson stock status B/BMSY and fishing mortality ratio F/FMSY indicating (Red = Overfished, Dark yellow = Overfishing, Yellow = Recovering and Green = Safe zone). Blue circles represent the estimated trajectories (1993-2017) of the Indo-Pacific Spanish mackerel fishery in WIO, Pakistan. Grey shaded area denotes 50%, 80% and 95% confidence interval. The symbols falling in each quadrant are defined in the legend (right upper corner).
Estimated results of CMSY and BSM method for Euthynnus affinis (A) Time series of catch (black line) and moving average (red line) (B) Relative biomass estimated by CMSY (blue lines) and BSM (red lines) (C) Curve estimated by CMSY (blue dots) and BSM (red dots) (D) Time series catch (E) Exploitation rate (F) Kobe plot of E. affinis stock status B/BMSY and fishing mortality ratio F/FMSY indicating (Red = Overfished, Dark yellow = Overfishing, Yellow = Recovering and Green = Safe zone). Blue circles represent the estimated trajectories (1993-2017) of the Kawakawa fishery in WIO, Pakistan. Grey shaded area denotes 50%, 80% and 95% confidence interval. The symbols falling in each quadrant are defined in the legend (right upper corner).
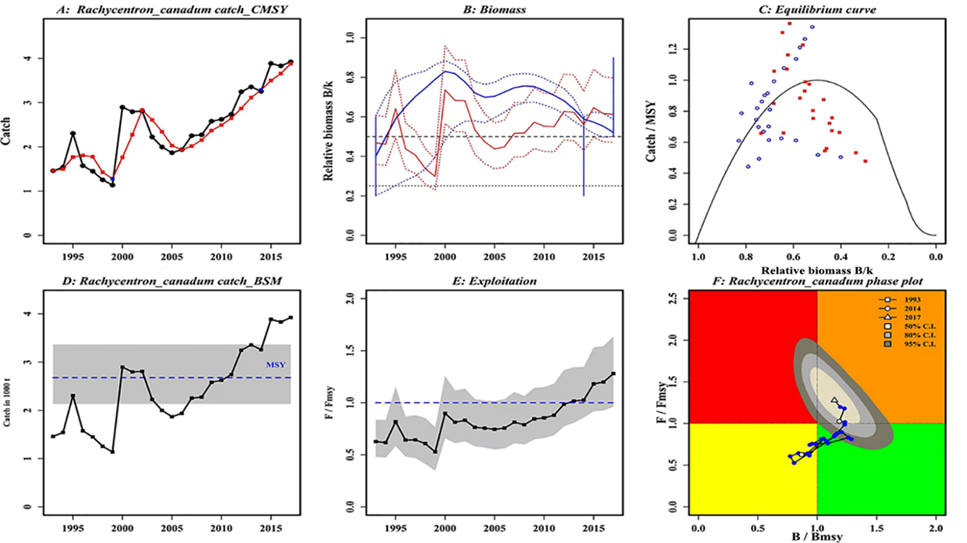
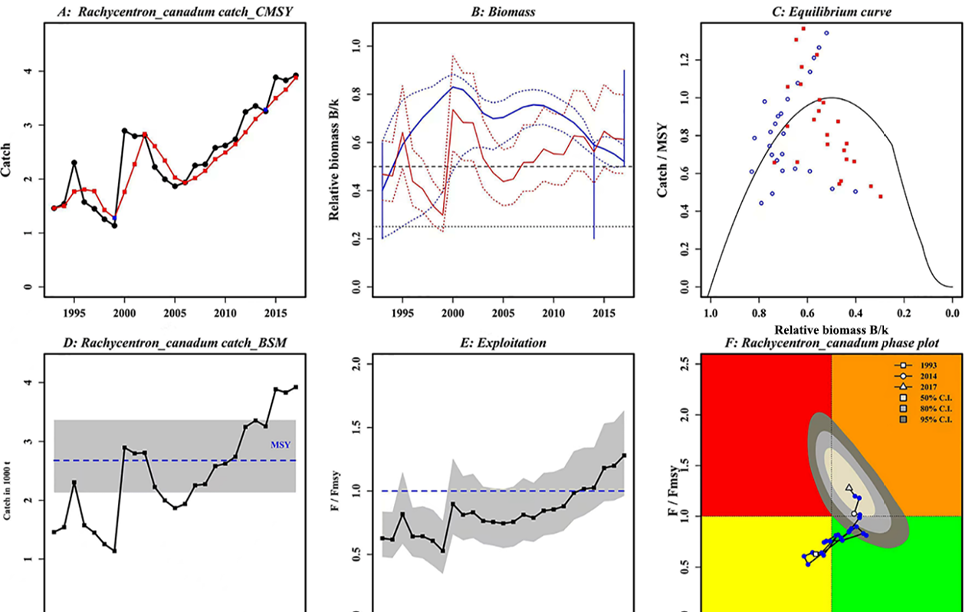
Estimated results of CMSY and BSM method for Rachycentron canadum (A) Time series of catch (black line) and moving average (red line) (B) Relative biomass estimated by CMSY (blue lines) and BSM (red lines) (C) Curve estimated by CMSY (blue dots) and BSM (red dots) (D) Time series catch (E) Exploitation rate (F) Kobe plot of R. canadum stock status B/BMSY and fishing mortality ratio F/FMSY indicating (Red= Overfished, Dark yellow = Overfishing, Yellow = Recovering and Green= Safe zone). Blue circles represent the estimated trajectories (1993-2017) of the Cobia fishery in WIO, Pakistan. Grey shaded area denotes 50%, 80% and 95% confidence interval. The symbols falling in each quadrant are defined in the legend (right upper corner).

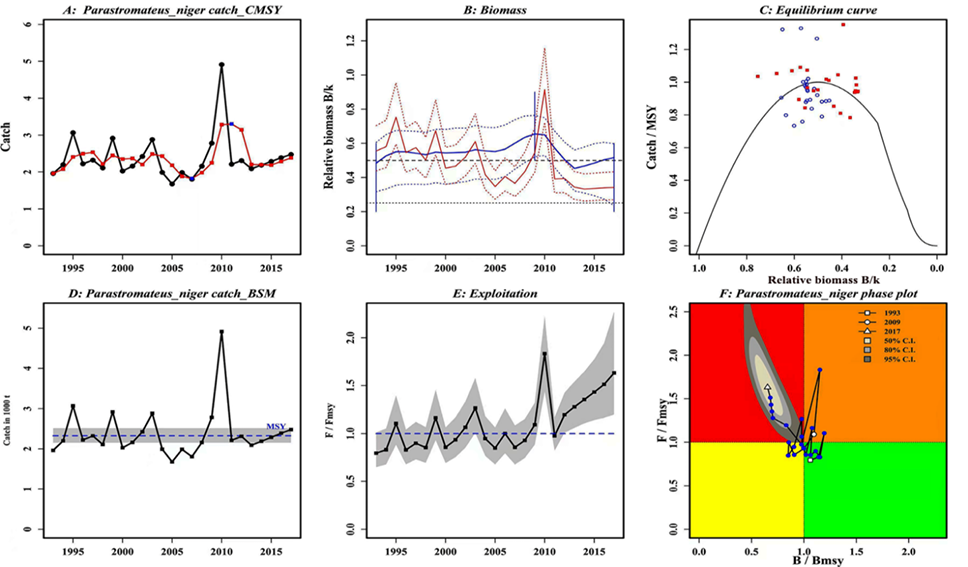
Estimated results of CMSY and BSM method for Parastromateus niger (A) Time series of catch (black line) and moving average (red line) (B) Relative biomass estimated by CMSY (blue lines) and BSM (red lines) (C) Curve estimated by CMSY (blue dots) and BSM (red dots) (D) Time series catch (E) Exploitation rate (F) Kobe plot of P. niger stock status B/BMSY and fishing mortality ratio F/FMSY indicating (Red= Overfished, Dark yellow = Overfishing, Yellow = Recovering and Green= Safe zone). Blue circles represent the estimated trajectories (1993-2017) of the Black pomfret fishery in WIO, Pakistan. Grey shaded area denotes 50%, 80% and 95% confidence interval. The symbols falling in each quadrant are defined in the legend (right upper corner).
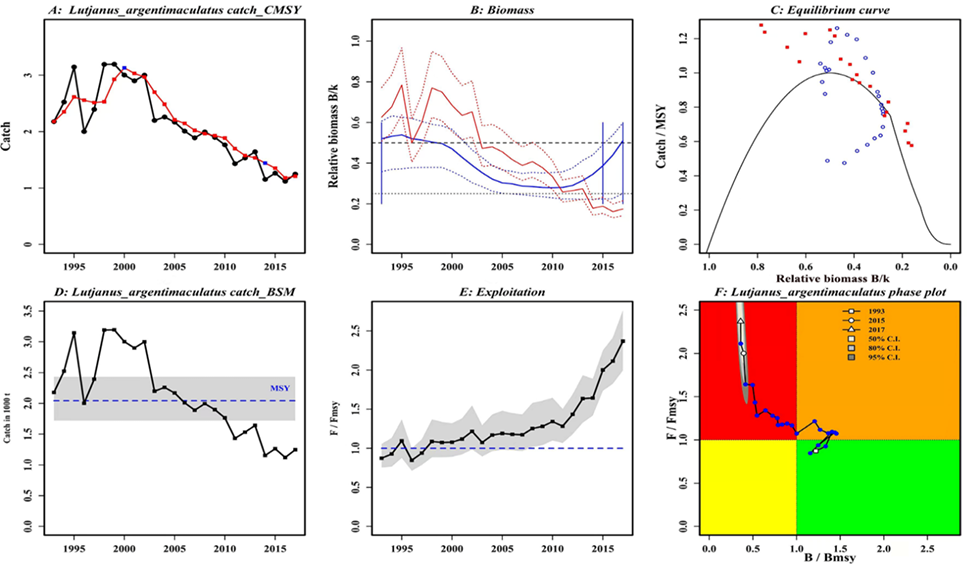
Estimated results of CMSY and BSM method for Lutjanus argentimaculatus (A) Time series of catch (black line) and moving average (red line) (B) Relative biomass estimated by CMSY (blue lines) and BSM (red lines) (C) Curve estimated by CMSY (blue dots) and BSM (red dots) (D) Time series catch (E) Exploitation rate (F) Kobe plot of L. argentimaculatus stock status B/BMSY and fishing mortality ratio F/FMSY indicating (Red= Overfished, Dark yellow = Overfishing, Yellow = Recovering and Green= Safe zone). Blue circles represent the estimated trajectories (1993-2017) of the Mangrove red snapper fishery in WIO, Pakistan. Grey shaded area denotes 50%, 80% and 95% confidence interval. The symbols falling in each quadrant are defined in the legend (right upper corner).


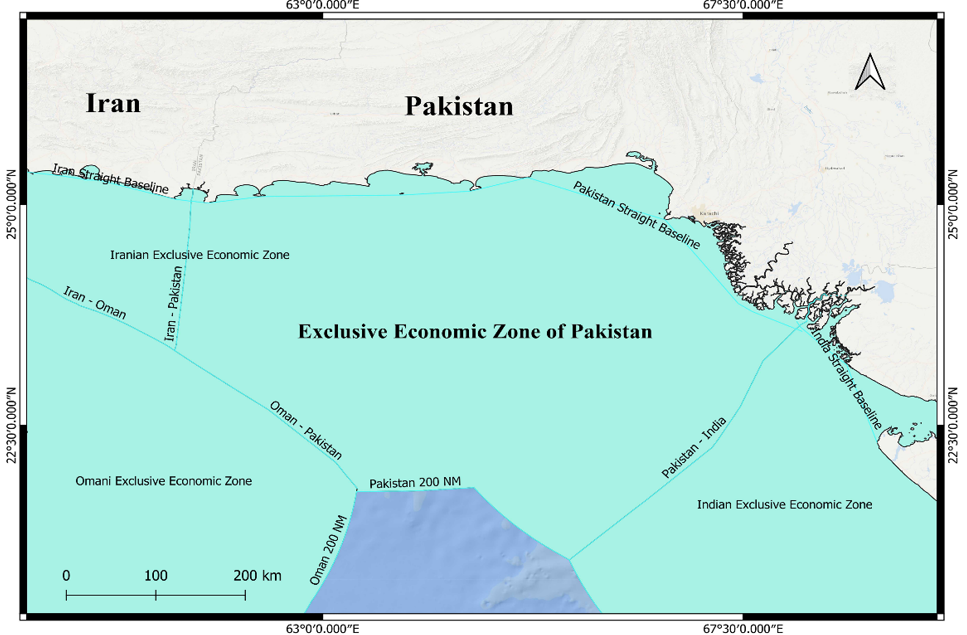
The map represented water territories of Pakistan.


