

Spatial-temporal Distribution of Spawning Grounds in the Western Guangdong Waters Based on Habitat Suitability Index Model


Spatial-temporal Distribution of Spawning Grounds in the Western Guangdong Waters Based on Habitat Suitability Index Model
Jing Yu1*, Yao Lu1,2, Zhaojin Lin1, Pimao Chen1 and Yuting Feng1,3
1South China Sea Fisheries Research Institute, Chinese Academy of Fishery Sciences; Guangdong Provincial Key Laboratory of Fishery Ecology and Environment; Scientific Observing and Experimental Station of South China Sea Fishery Resources and Environment, Ministry of Agriculture and Rural Affairs; Guangzhou 510300, PR China.
2College of Marine Science, Shanghai Ocean University, Shanghai 201306, PR China.
3College of Chemistry and Environment, Guangdong Ocean University, Zhanjiang 524088, PR China.
ABSTRACT
The western Guangdong Waters (WGW) locates in the northern South China Sea (SCS), and is an important area for fishes spawning, feeding, breeding, and migrating. This study built the Suitability Index (SI) Model for the spatial-temporal distribution of spawning grounds in the WGW based on the simple non-linear regression, using satellite remote sensing and investigation data during April to June in 2014 and 2015. Satellite data including Sea Surface Temperature (SST), Sea Surface Salinity (SSS) and water Depth from Digital Elevation Model (DEM) were used to build the Habitat Suitability Index (HSI) model, based on Maximum Model (MAXM), Minimum Model (MINM), Arithmetic Mean Model (AMM), and Geometric Mean Model (GMM). Results showed that the accuracy of the HSI model was 80%. HSI model built for fish-egg density during April, May and June based on GMM and MINM had the highest accuracy. High HSI area was mainly distributed in the eastern Leizhou Peninsula. HSI distribution was similar to the investigation of spawning grounds, indicating the good performance of the HSI model based on GMM and MINM in forecasting spawning grounds in the Western Guangdong Waters.
Article Information
Received 03 March 2020
Revised 01 June 2020
Accepted 29 July 2020
Available online 03 September 2021
Authors’ Contribution
JY and YL designed the study. ZL collected the spawning ground data. YL analyzed the data. PC and YF helped collect and analyze the data. JY and YL wrote the article.
Key words
Spawning ground, Habitat suitability index model, Remote sensing, Western Guangdong waters
DOI: https://dx.doi.org/10.17582/journal.pjz/20200318060343
* Corresponding author: yujing@scsfri.ac.cn
0030-9923/2021/0006-2033 $ 9.00/0
Copyright 2021 Zoological Society of Pakistan
INTRODUCTION
Spawning ground is the waters for mating, spawning, hatching and growing of fish, shrimp and shellfish. Therefore, it is an essential space for aquatic creatures living and breeding (Wan et al., 2010).
Fish egg is a crucial stage in the early life of fishery population, which is also the stage most vulnerable to the changes of habitat environment. Fishes concentrate and spawn in an environment suitable for the survival and growth of fish eggs to improve the survival rate of their off springs (Bellier et al., 2010). Previous studies proposed that spatial distribution of the fish eggs were closely related to sea surface temperature, sea surface salinity, depth (Lelièvre et al., 2014) and seafloor relief (Flores et al., 2019) of the spawning ground.
Western Guangdong Waters (WGW) located in the northern South China Sea (SCS), stretches from the estuary of the Pearl River to Hainan Island, and meets the Beibu Gulf in the Qiongzhou Strait (Su et al., 2019). It is an important area for many commercial fishes spawning, feeding, breeding and migration (Yu et al., 2019c). Previous studies centered on biological characteristics of fish eggs and species composition (Emel’yanova and Pavlov, 2012), which provided fundamental information of spawning grounds. However, the response mechanism of spawning grounds to habitat environmental factors was less known.
Habitat suitability index (HSI) was widely applied in studies on fishery forecasts for being able to simulate the organism’s response to environmental factors (Eastwood et al., 2001). The HSI model had developed rapidly in fishery research by combining with satellite remote sensing technology (Yu et al., 2019b). For example, HSI was used to forecast the distribution of the fishing ground of Ommastrephes bartramii (Yu et al., 2020), and analyze the optimum fishery habitats in the spawning season (Gillenwater et al., 2006). HSI was also used to analyze the characteristics of its fishing ground of Dosidicus gigas, and explore the relationship between its habitat quality and environmental factors (Yu and Chen, 2018b). This study built a model for fish eggs and environmental factors in the WGW based on HSI, explored the impact of environmental changes on the location and size of spawning grounds, analyzed the spatial-temporal changes of fish-egg density, and forecast the location and abundance of spawning grounds in the study waters.
Satellite remote sensing offers all-weather, large-scale and high-resolution sea surface data, and has already been applied in marine fisheries (Yu et al., 2019a). This study used field investigation data and remote sensing data, built and verified the HSI model based on marine environmental factors. The relationship between major fishes’ spawning grounds and environmental factors in the WGW was also explored. The results of this study provide references for protecting the habitats of major fishes in the northern SCS.
MATERIALS AND METHODS
Investigation and identification of fish eggs
Fish eggs data came from the spawning ground investigation in the WGW during April to June in 2014 and 2015 respectively, covering the areas of 110°-113°E and 19.5°-22°N (Fig. 1). Fish eggs were sampled by macro-plankton nets, with hauling speed of 1.5 n mile/h. Fish eggs were preserved in 5% formaldehyde solution, for morphological characteristics and counting (Wang et al., 2010). Fish-egg data were calculated as one fishing area according to the spatial resolution (0.25°×0.25°), and the unit of fish-egg density was ind/1000m3. Fish eggs data included voyage of fishing boats, investigation time, longitude, latitude, and spawn density.
Satellite remote sensing data
Sea surface temperature (SST), sea surface salinity (SSS) and digital elevation model (DEM) of the seafloor relief were taken from satellite remote sensing (Yu et al., 2018c). SST was from NASA MODIS Aqua (https://oceandata.sci.gsfc.nasa.gov/), with a temporal resolution of 8 days, a spatial resolution of 4 km. SSS was from Global Ocean Physical Reanalysis Product data of Copernicus Marine Environment Management Service (CMEMS, http://marine.copernicus.eu), with a temporal resolution of the month, and a spatial resolution 1/12°×1/12°. DEM was from Google Earth-elevation data, elevation level was 18, spatial resolution 8.85 m. Depth data was from elevation representation in DEM data.
Spatial autocorrelation analysis
Spatial autocorrelation refers to the following issue: values of an attribute at closer geographical sites are more similar (positive autocorrelation) or more dissimilar (negative autocorrelation) than values at two distant sites (Wang et al., 2016). At the beginning of the study, the global spatial autocorrelation (Cliff and Ord, 1982) analysis was used to determine whether there is a significant relationship between the fish-egg density and geographical factors (Latitude and longitude). Global spatial autocorrelation parameters include Global Moran’s I and Getis-Ord General G (Swetnam et al., 2015). They were used to detect global spatial cluster and its variations in the study. Global Moran’s I is calculated as follows (Ren et al., 2020):

xi is fish-egg density of pixel i, xj is fish-egg density of pixel j, x is average fish-egg density, n is the number, and Wij is the aggregate of all spatial weights. If the pixel i and pixel j are adjacent, the value of corresponding element in the matrix Wij is 1, otherwise it is 0.
To investigate the statistical significance of the Moran’s I statistic, Z(I) is calculated as follows:
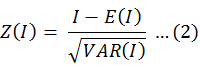
where E(I) is the expected value of I: E(I) = − 1/(n − 1), and VAR(I) is the expected variance of I: VAR(I)=E(I2)-E(I2). When a significance level is established, a Moran’s I approaching +1 indicates that fish-egg density data is spatially correlative. When the value of Moran’s I is close to −1, a discrete data pattern is observed. If the Moran’s I value is close to 0 When |Z(I)|> 1.96, P value < 0.05 (Xiao et al., 2018), the null hypothesis is accepted and the fish-egg density data are distributed randomly (Getis and Ord, 1992).
Getis-Ord General G is determined as follows (Getis and Ord, 1992):

where xi is fish-egg density of pixel i, xj is fish-egg density of pixel j, and Wij is the spatial weight inversely correlated with the distance between the two locations. The expectation of G and Z(I) is calculated as follows:
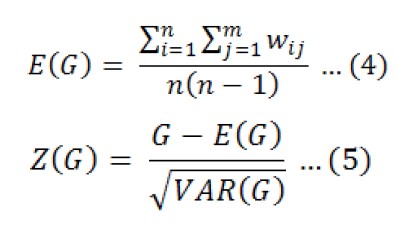
In general, if the value of G is greater than E(G), the high-value data tend to cluster. Otherwise, low-value data tend to cluster. The fish-egg density data in the regions distributes randomly when G is equal to E(G) (Ren et al., 2020).
Suitability index model
Suitability index (SI) model was built accordingly to fish-egg density, SST, SSS and Depth data. This research supposed the waters with the highest fish-egg density was the optimum spawning area, HSI was 1. And the waters with the least fish-egg density (0) was the unsuited spawning area, HSI was 0. Of the spawn data, 80% was applied to build the model, and the left 20% to verify the model. SI of the single-factor habitat was calculated using the equation (Hua et al., 2020).
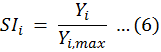
Where SIi refers to the suitability index in the ith month; Yi is the fish-egg density in the ith month; Yi,max is the maximum fish-egg density being caught in the ith month.
Habitat suitability index model
Using the simple non-linear regression (Fan et al., 2015; Li et al., 2016), the relation model between SI and SST, SSS and Depth could be built, as the equation below.
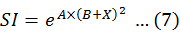
Where, A and B indicate coefficients of the model, and X the value of environmental factors. HSI was calculated based on the single-factor SI using Maximum Model (MAXM) (Yu et al., 2019b), Minimum Model (MINM) (Van der Lee et al., 2006), Arithmetic Mean Model (AMM) (Yu et al., 2018a) and Geometric Mean Model (GMM) (Tian et al., 2009), in below equations.
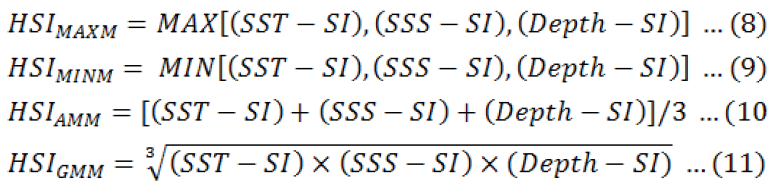
Where, SST-SI, SSS-SI and Depth-SI were the SI-value of SST, SSS and Depth.
The left 20% investigation data were taken into the 4 equations to verify the accuracy of the model. The forecast was considered accurate if the error between theoretical value and actual value was less than 0.4, and inaccurate if not (Tian et al., 2009). HSI distribution was plotted through ArcGIS 10.5 (Wang et al., 2019).
RESULTS
Species identification
According to the morphological characteristics, major fish eggs in the area belong to: Trichiurus haumela, Carangidae, Nemipteras virgatus, Sardinella aurita, Anchoviella commersonii, which are consistence with related researches (Zhang et al., 2016; Zhao and Jia, 2020). The fish-egg density of major fish accounts for more than 90% of the total density. These fish eggs are popular commercial fish eggs and generally distributed in the tropical and warm waters (Yu et al., 2019b).
Global spatial autocorrelation of spawning grounds
In Table I, the Global Moran’s I, Getis-Ord General G, their expectations and z-scores were calculated with fish-egg density data in the study area from April to June. The values of Global Moran’s I varied from 0.22 to 0.36 and were significant at the 95% confidence level (Z (I) > 1.96, P value<0.05). This indicated that fish-egg density in the study area showed significant spatial correlation from April to June. General G observations are all larger than expectations and were significant at the 95% confidence level (Z (I) > 1.96, P value<0.05). This suggested that fish-egg density in the study area tended to be a cluster of high values.
Table I. Global spatial autocorrelation of fish-egg density in WGW from April to June.
|
Month |
Moran’s I |
Z(I) |
General G |
E(G) |
Z(G) |
|
April |
0.36 |
6.79 |
0.000019 |
0.000002 |
6.97 |
|
May |
0.30 |
5.01 |
0.000008 |
0.000002 |
5.40 |
|
June |
0.22 |
2.77 |
0.000006 |
0.000002 |
2.43 |
Between April and June, the Moran’s I decreased from 0.36 to 0.22, demonstrating a significant decrease in the fish-egg density cluster. The difference between estimated and expected General G decreased, indicating that the correlation degree of high-value fish-egg density data decreased. Moran’s I peaked at 0.36 in April as did the difference between measured and expected value of General G. In June, the estimated value of Moran’s I (0.22) and the difference between estimated and expected General G were the lowest for the study period. The global spatial autocorrelation analysis has shown that the fish-egg density distribution in the study area has significant spatial autocorrelation and the high value area has been cluster.
SI of environmental factors
According to the simple linear regression, SI of each environmental factor and fish-egg density in different months were shown in Table II. The significance test (P < 0.05) indicated that the models were quite accurate. Through the fitting of SST, SSS and Depth, the comparison chart between the actual fish-egg density and the fitting result was shown in Figure 2. SI model of fitting factors in each month reflected variations of fish-egg density with the changes of environmental factors. All models showed unimodal distribution, and the simulation results were basically correct.
Table II. SI models of environmental factors.
|
Month |
Variable |
SI model |
P value |
|
April |
SST |
SI=e-0.98927×(SST-24.81931)2 |
0.0375 |
|
SSS |
SI=e-1.97031×(SSS-33.08861)2 |
0.0002 |
|
|
Depth |
SI=e-0.0161×(Depth-9.1008)2 |
0.0000 |
|
|
May |
SST |
SI=e-0.63401×(SST-28.13493)2 |
0.0026 |
|
SSS |
SI=e-0.07773×(SSS-35.40476)2 |
0.0000 |
|
|
Depth |
SI=e-0.01031×(Depth-12.55199)2 |
0.0001 |
|
|
June |
SST |
SI=e-0.64818×(SST-29.37173)2 |
0.0001 |
|
SSS |
SI=e-2.8732×(SSS-33.99679)2 |
0.0392 |
|
|
Depth |
SI=e-0.00232×(Depth-19.97159)2 |
0.0071 |
Optimum value of environmental factors
By obtaining the first derivative of each SI model, making it equal to zero, the value at the peak SI of each environmental factor could be calculated, that is, the optimum value of the spawning ground environmental factor in this month (Li et al., 2016). The results were shown in Table III.
Table III. Optimum value of environmental factors.
|
Month |
SST (°C) |
SSS |
Depth (m) |
|
April |
24.82±0.2 |
33.09±0.1 |
9.1±0.55 |
|
March |
28.13±0.17 |
35.40±0.73 |
12.55±0.81 |
|
June |
29.37±0.12 |
34.00±0.61 |
19.97±4.3 |
As for SST, the suitable range for fish eggs in April was 24.62-25.02°C, the optimum SST was 24.82°C. The suitable SST range for fish eggs in May was 27.96-28.31°C, the optimum was 28.13°C. In June, the suitable SST range for fish eggs was 29.25-29.50°C, the optimum was 29.37°C (Fig. 2, Table III).
As for SSS, the suitable range for fish eggs in April was 32.99-33.19 Practical Salinity Unit (PSU), the optimum SSS was 33.09 PSU. The suitable SSS range for fish eggs in May was 34.67-36.14 PSU, the optimum was 35.40 PSU. In June, the suitable SSS range for fish eggs was 33.39- 34.60 PSU, and the optimum was 34.00 PSU (Fig. 2, Table III).
As for Depth, the suitable range for fish eggs in April was 8.55-9.65 m, the optimum was 9.1 m. The suitable Depth range in May was 11.74-13.36 m, the optimum was 12.55 m. The suitable depth range in June was 15.67-24.28 m, and the optimum was 19.97 m (Fig. 2, Table III).
Verification of HSI model
AMM, GMM, MAXM and MINM were applied to establish the HSI model, and data for model verification were imported to the models to get the theoretical HSI value and compare with the actual SI value. The model was considered accurate if the error between the HSI value and actual value was less than 0.4 (Tian et al., 2009), the precision verification results of the models were shown in Table IV.
|
Month |
AMM |
GMM |
MAXM |
MINM |
|
April |
52.75% |
95.60% |
15.38% |
94.51% |
|
May |
37.37% |
90.91% |
18.18% |
77.78% |
|
June |
31.31% |
48.48% |
14.14% |
63.64% |
GMM gained the highest precision in April (95.60%) and May (90.91%), and MAXM had the lowest precision in April (15.38%) and May (18.18%) (Table III). In June, MINM had the highest precision (63.64%), and MAXM had the lowest precision (14.14%). Therefore, GMM showed the highest precision in April and May, and MINM had the highest precision in June. According to the verification results, GMM was applied to establish HSI model with SI data in April and May, and MINM was applied to build HSI model with the data in June. The precision of the established HSI model in each month was higher than 60% (Table IV).
HSI forecast results basically complied with the distribution of fish eggs (Fig. 3). Of which, fish-egg density in April was higher (>5000ind/1000m3) in the northwest of the study waters (110.5°-111°E, 21°-21.5°N), HSI in this region was also higher (>0.6). In the northeast of the study waters (111.5°-113°E, 21°-21.5°N), fish-egg density was lower (<2500ind/1000m3), and HSI was also lower (<0.4). The forecast results complied with the actual distribution in these areas. It was noticed that in the waters
around the Qiongzhou Strait (110.5°-111°E, 20°-20.5°N), fish-egg density was higher (>5000ind/1000m3), but HSI in this region was lower (<0.4).
Fish-egg density in the northwest of the study waters (110.5°-111°E, 21°-21.5°N) in May was higher (>5000ind/1000m3), HSI in this region was also higher (>0.6). But in the north of the study area (111.5°-112°E, 21°-21.5°N), fish-egg density was higher (>5000ind/1000m3), but HSI was lower (<0.4). In the waters around the Qiongzhou Strait (110.5°-111°E, 20°-20.5°N), fish-egg density was higher (>5000ind/1000m3), but HSI in this region was lower (<0.4).
In June, higher fish-egg density (>5000ind/1000m3) shifted from northwest to south (110.75°-111.25°E, 20.5°-21.25°N). Higher HSI (>0.6) also shifted the southwards, to the region of 110.5°-111°E, 20.5°-21°N, in this region HSI complied with the actual value basically. In the northwest of the study waters (111.5°-113°E, 21°-22°N), fish-egg density was lower (<2500 ind/1000m3), and HSI was also lower (<0.4), the forecast results basically complied with the actual value. In the waters around the Qiongzhou Strait (110.5°-111.5°E, 19.75°-20.5°N), fish-egg density was lower (<2500ind/1000m3), HSI was lower (<0.4).
DISCUSSION
Relationship between HSI and investigation data
HSI model can be built according to the non-linear relationship between fish-egg distribution and marine environment, its advantages of forecasting the distribution of spawning grounds accurately (Gillenwater et al., 2006). The spatial autocorrelation analysis showed that the distribution of fish eggs was clustered and the areas with high fish-egg density were clustered (Table I). HSI model can better forecast high-density region. The high-density region (northwest from April to June) and low-density region (northeast in April and June, and the Qiongzhou Strait in June) forecast by the model complied with the actual distribution of fish-egg density (Fig. 3). Previous studies showed that the spatial distribution of high value area forecasted by HSI model was correlation with the area of high stock density (Yu et al., 2018a; Hua et al., 2020), which is consistent with this research. The tendency of high-density fish-egg shifting southeastwards in April and May, and high-density fish-egg shifting southwards in May and June was the same as the results in the HSI model (Fig. 3). Previous studies have shown that the HSI model can accurately forecast spatial position changes (Hua et al., 2020).
However, the regions with actual high fish-egg density (the north region in May, and the Qiongzhou Strait in April and May) were marked as the low-density regions by the model, thus the forecast results varied greatly from the actual distribution of fish-egg density (Fig. 3). As fish eggs could not swim or move spontaneously (Wan et al., 2010), fish eggs floating in water were vulnerable to current. Therefore, complicate seafloor, which slows down the current, enables fish eggs to gather and provide a favorable survival environment for the spawning groups (Yi et al., 2013). Seafloor around the Qiongzhou Strait had greater fluctuations (dense isobath), its large seafloor slopes made complicate underwater environment (Fig. 1b), providing an ideal environment for spawning, resulting in high fish-egg density in this area during April and May. In this research, the seafloor factor, such as underwater topographic slope, was not considered in the HSI model, partly resulted to the deviation between HSI forecast and actual value in the Qiongzhou Strait.
High-value regions in the WGW forecast by HSI model showed the distribution tendency of “higher west and lower east” (Fig. 3), and continuously shifted southwards with the time. This was connected with the ocean current in this area. The previous study showed that there was a westward coastal current all the year-round in the WGW. The current flew westwards and then shifted towards the south nearby the Leizhou Peninsula, and finally entered the Beibu Gulf after flowing westwards through the Qiongzhou Strait (Wang et al., 2010). Fish eggs floating in water in each moth would be influenced by the westward coastal current and drifted to the west, then gathered nearby the Leizhou Peninsula, and finally formed the distribution tendency of higher west and lower east. In addition, the westward coastal current shifted southwards near the Leizhou Peninsula, resulting in the southwards shifting of the high HSI region in each month.
Relationship between the spatial distribution of spawning grounds and marine environment
Water temperature is a key factor influencing quantity and distribution of fish eggs, because it could influence quantity, distribution and population structure by affecting the gonad development and spawning migration of adult fishes (Mendiola et al., 2006). This research obtained the optimum SST for fish eggs in the WGW was 24.82 °C (April), 28.13 °C (May) and 29.37 °C (June), respectively (Table III). Previous researches showed that the optimum water temperature for fish eggs of Trichiurus haumela in the WGW was 25-28 °C (Lin, 1981), which complied with the results of this research. From April to June, suitable temperature for fish eggs increased gradually, but the high HSI area in June achieved the minimum, and fish-egg density in June reduced greatly from that in April and May (Fig. 3). The water temperature had a substantial impact on the process of metamorphosis (Régnier et al., 2018) and hatching speed (Poloczanska et al., 2013). In addition, higher water temperature in June (Fig. 2g) would reduce the survival rate of fish eggs that intolerable to high temperatures. For the fish eggs suitable for higher temperatures, the higher water temperature would accelerate the development of fish eggs, shorten the growth period, and promote the speed of hatching, which both led to the decrease of fish-egg density (Mendiola et al., 2006). As a result, water temperature provided a significant reference for defining the quantity and location of spawning grounds in the WGW.
Salinity is also an important factor influencing the metabolism of fishes, and fish eggs as the most fragile stage in the fish life are most vulnerable to the environment (Giffard-Mena et al., 2020). According to the SI model, the optimum SSS for fish eggs in the WGW in the northern SCS was 33.09±0.1 PSU (April), 35.40±0.73 PSU (May), and 34.00±0.61 PSU (June) (Table III). The previous study showed that the Fish eggs in the northern SCS lived in the regions with SSS of 33.24-34.66 PSU (Li et al., 2014), the optimum SSS for fish eggs of Trichiurus haumela was 33.0-34.5 PSU (Lin, 1981), the optimum SSS for fish eggs of Decapterus maruadsi was 32.0-35.0 PSU (Zhang, 1985), and 33-34.4 PSU for fish eggs of Sardinella aurita (Jiang and Lin, 1983), which complied with results of this research. By comparing the actual fish-egg density and fitting results of the SI model, it was found that fish-egg density achieved high value (Fig. 2b, 2e, 2h) as SSS was higher (SSS>33). The possible reason was that salinity impacted the embryo development by changing the osmotic pressure of fish eggs, too high or low salinity would reduce the hatching rate by blocking the normal exchange between oosperms and surrounding media, and thus caused the developmental malformation of embryos (Giffard-Mena et al., 2020). Moreover, salinity also influenced the vertical distribution of fish eggs in water. In low-salinity waters, fish eggs were likely to concentrate in piles and lack of oxygen held back the spawn development. On the contrary, in high-salinity waters, fish eggs could suspend or float in water and easily breathe, which would contribute to a higher hatching rate of fish eggs (Nissling et al., 2017).
Fishes preferred to spawn in deeper waters with suitable conditions (Lelièvre et al., 2014). The optimum Depth obtained by the SI model was 9.1 m (April), 12.55 m (May) and 19.97 m (June) (Table III). Fish eggs of Anchoviella commersonii in the study waters were mainly distributed in water depth < 20 m (Wu, 1989), and fish eggs of Sardinella aurita in water depth around 10 m (Zhang and Huang, 2003), which consisted with this study. Spawning grounds in the WGW were mainly distributed in water depth < 30 m, fish-egg density in shallow waters was obviously higher than that in deep waters (Fig. 2c, 2f, 2i). The breeding interval of fishes in deep water might be prolonged for the harsh environment and less food (annual to perennial), resulting in lower fish-egg density in deep waters than those in shallow waters (Fernandez-Arcaya et al., 2016).
Method selection of HSI model building
In the construction of the HSI model, the most applied methods include Continued Product Model (CPM), MAXM, MINM, AMM, GMM and so on (Vayghan et al., 2013). This study compared HSI models built on the basis of MAXM, MINM, AMM and GMM, the precision of the models varied greatly (Table IV). GMM-based HSI had the highest accuracy (Table IV), a geometrical mean of each SI factor was used to build the model. In the HSI model for Trachurus murphyi in the southeast Pacific, GMM could better define the habitat and predict the habitat area (Li et al., 2016). Using fewer factors in the model building at the same time could improve the accuracy of GMM (Terrell, 1985), in this research GMM has the highest accuracy in April and May. Simultaneous application of 3 SI factors helped improve the accuracy of the GMM-based model, thus GMM was used to build HSI model in April and May. MINM had the second highest accuracy only after GMM (Table IV), and its evaluation of fish-egg density was mostly conservative for using the minimum value of SI factors, thus it was suitable for low-density regions and often applied to evaluate and build the HSI model for fishery conservation areas (Van der Lee et al., 2006). According to the HSI model for Trachurus murphyi in the southeast Pacific Ocean, MINM had higher accuracy in months with lower resource density (Fang et al., 2010). According to the HSI model for Decapterus maruadsi in the north of the SCS, MINM was suitable for model building in spring with fewer resources (Fan et al., 2015). In this research, fish-egg density in June reduced greatly from that in April and May, and low-density spawning regions were widely distributed (Fig. 3c), thus MINM had the highest accuracy in June.
AMM was a frequently-used method of the building model, mostly applied in assessing the quantity of resources by building the model on the basis of SI factors’ mean. The forecast results of AMM were less vulnerable to extreme SI values, but different influence degrees of SI factors were not considered, because all SI values were equally treated (Yu et al., 2018a). In the western Pacific, the HSI model based on the AMM could better reflect the distribution of Katsuwonus pelamis under different El Niño events (Yen et al., 2017). AMM showed lower accuracy in this research (Table IV). Using maximum values of SI factors to build HSI model, MAXM always led to too optimistic HSI results, and its accuracy was influenced by being limited by the maximum SI factors (Yu et al., 2019b). MAXM was suitable for forecasting the center of spawning grounds and the months with higher resource density (Fang et al., 2010). To build the HSI model for Trachurus japonicus in the north of the SCS, MAXM was only applicable for the seasons with high resource density (Yan et al., 2018). In this research, there were maximum values in each month for the extraordinarily high fish-egg density, such extraordinary maximum values in the model building led to over-estimation of fish-egg density. Therefore, MAXM had the lowest accuracy in this research.
CONCLUSIONS
In this study, the HSI model of the distribution of spawn grounds in the WGW was built, using satellite remote sensing and field investigation. The study found that the HSI model based on the GMM and MINM could better reflect the distribution and shifting of spawning grounds, and it could better reflect the relationship between the spawning grounds and the marine environment in the WGW. The distribution of spawning grounds in the WGW was forecasted also. Environmental factors which were acquired easily from remote sensing were used to build the HSI model. In order to improve the accuracy of HSI forecasting, other parameters such as spatial autocorrelation, seafloor relief, current, wind, etc. will be considered in the follow-up research.
ACKNOWLEDGEMENT
This study was supported by National Key R and D Program of China (2018YFD0900901), Natural Science Foundation of Guangdong Province, China (2018A030313120), Central Public-interest Scientific Institution Basal Research Fund, CAFS, China (2018HY-ZD0104), State Key Laboratory of Tropical Oceanography, South China Sea Institute of Oceanology and Chinese Academy of Sciences, China (Project No. LTO1806).
Statement of conflict of interest
The authors have declared no conflicts of interest.
REFERENCES
Bellier, E., Planque, B. and Petitgas, P., 2010. Historical fluctuations in spawning location of anchovy (Engraulis encrasicolus) and sardine (Sardina pilchardus) in the Bay of Biscay during 1967-1973 and 2000-2004. Fish Oceanogr., 16: 1-15. https://doi.org/10.1111/j.1365-2419.2006.00410.x
Cliff, A.D. and Ord, J.K., 1982. Spatial processes. Models and applications. Population, 37: 963. https://doi.org/10.2307/1532472
Eastwood, P.D., Meaden, G.J. and Grioche, A., 2001. Modelling spatial variations in spawning habitat suitability for the sole Solea solea using regression quantiles and GIS procedures. Mar. Ecol. Prog. Ser., 224: 251-266. https://doi.org/10.3354/meps224251
Emel’yanova, N.G. and Pavlov D.A., 2012. Gamete ultrastructure in some species of the family Mullidae from the South China Sea. J. Ichthyol., 52: 639-645. https://doi.org/10.1134/S0032945212060021
Fan, J.T., Huang, Z.R., Xu, Y.W., Sun, M.S., Chen, G.B. and Chen, Z.Z., 2018. Habitat Model Analysis for Decapterus maruadsi in Northern South China Sea Based on Remote Sensing Data. Trans. Oceanol. Limnol., 40: 142-147 (in Chinese with English Abstract).
Fan, J.T., Zhang, J., Feng, X. and Chen, Z.Z., 2015. Fishery forecast research of purpleback flying squid in Nansha area based on Habitat model. S. China Fish. Sci., 11: 20-26. (in Chinese with English Abstract).
Fang, Y., Zou, X.R., Zhang, M., Xie, F. and Wu, X.L., 2010. A comparative study on habitat suitability index of Chilean Jack Mackerel in Southeast Pacific Ocean. Mar. Fish., 32: 178-185. (in Chinese with English Abstract).
Fernandez-Arcaya, U., Drazen, J.C., Murua, H., Ramirez-Llodra, E., Bahamon, N., Recasens, L., Rotllant G. and Company, J.B., 2016. Bathymetric gradients of fecundity and egg size in fishes: A Mediterranean case study. Deep Sea Res. Part I: Oceanogr. Res. Pap., 116: 106-117. https://doi.org/10.1016/j.dsr.2016.08.005
Flores, E.A., Castro, L.R., Narváez, D.A., Lillo, S., Balbontín, F. and Osorio-Zúñiga, F., 2019. Inter-annual and seasonal variations in the Outer and Inner Sea spawning zones of southern hake, Merluccius australis, inferred from early life stages distributions in Chilean Patagonia. Prog. Oceanogr., 171: 93-107. https://doi.org/10.1016/j.pocean.2018.12.013
Getis, A. and Ord, J.K., 1992. The analysis of spatial association by use of distance statistics. Geogr. Anal., 24: 189-206. https://doi.org/10.1111/j.1538-4632.1992.tb00261.x
Giffard-Mena, I., Hernández-Montiel, Á.H., Pérez-Robles, J. and David-True, C., 2020. Effects of salinity on survival and plasma osmolarity of Totoaba macdonaldi eggs, larvae, and juveniles. J. Exp. Mar. Biol. Ecol., 526: 151339. https://doi.org/10.1016/j.jembe.2020.151339
Gillenwater, D., Granata, T. and Zika, U., 2006. GIS-based modeling of spawning habitat suitability for walleye in the Sandusky River, Ohio, and implications for dam removal and river restoration. Ecol. Eng., 28: 311-323. https://doi.org/10.1016/j.ecoleng.2006.08.003
Hua, C., Li, F., Zhu, Q., Zhu, G. and Meng, L., 2020. Habitat suitability of Pacific saury (Cololabis saira) based on a yield-density model and weighted analysis. Fish Res. 221: 105408. https://doi.org/10.1016/j.fishres.2019.105408
Jiang, S.F. and Lin, L.Y., 1983. Studies on the eggs and larvae of Sardinella Aurita (Cuv. and Val.) in the fishing ground of the Southern-Fujian and Taiwan bank. Oceanol. Limnol. Sin., 14: 240-249 (in Chinese with English Abstract).
Lelièvre, S., Vaz, S., Martin, C.S. and Loots, C., 2014. Delineating recurrent fish spawning habitats in the North Sea. J. Sea Res., 91: 1-14. https://doi.org/10.1016/j.seares.2014.03.008
Li, G., Cao, J., Zou, X., Chen, X. and Runnebaum, J., 2016. Modeling habitat suitability index for Chilean jack mackerel (Trachurus murphyi) in the South East Pacific. Fish. Res., 178: 47-60. https://doi.org/10.1016/j.fishres.2015.11.012
Li, K., Yin, J., Huang, L. and Lin, Z., 2014. Seasonal variations in diversity and abundance of surface ichthyoplankton in the northern South China Sea. Acta Oceanol. Sin., 33: 145-154. https://doi.org/10.1007/s13131-014-0533-3
Lin, J.Q., 1981. Studies on the natural regulaive adaptibility of the Hairtail (Trichiurus haumela) in the oceanic environment. Trans. Oceanol. Limnol., 3: 60-65 (in Chinese with English Abstract).
Mendiola, D., Alvarez, P., Cotano, U., Etxebeste, E. and de Murguia, A.M., 2006. Effects of temperature on development and mortality of Atlantic mackerel fish eggs. Fish Res., 80: 158-168. https://doi.org/10.1016/j.fishres.2006.05.004
Nissling A., Nyberg S. and Petereit C., 2017. Egg buoyancy of flounder, Platichthys flesus, in the Baltic Sea adaptation to salinity and implications for egg survival. Fish Res., 191: 179-189. https://doi.org/10.1016/j.fishres.2017.02.020
Poloczanska E.S., Brown C.J., Sydeman W.J., Kiessling W., Schoeman D.S., Moore P.J., Brander K., Bruno J.F., Buckley L.B. and Burrows M.T., 2013. Global imprint of climate change on marine life. Nat. Clim. Change, 3: 919-925. https://doi.org/10.1038/nclimate1958
Régnier T., Gibb, F.M. and Wright, P.J., 2018. Temperature effects on egg development and larval condition in the lesser sandeel, Ammodytes marinus. J. Sea Res., 134: 34-41. https://doi.org/10.1016/j.seares.2018.01.003
Ren, H., Shang, Y. and Zhang, S., 2020. Measuring the spatiotemporal variations of vegetation net primary productivity in Inner Mongolia using spatial autocorrelation. Ecol. Indic., 112: 106108. https://doi.org/10.1016/j.ecolind.2020.106108
Su, Y.J., Chen, G.B., Zhou, Y.B., Ma, S.W. and Wu, Q.E., 2019. Assessment of impact of summer fishing moratorium in South China Sea during 2015−2017. S. China Fish. Sci., 15: 20-28 (in Chinese with English Abstract).
Swetnam, T.L., Lynch, A.M., Falk, D.A., Yool, S.R. and Guertin, D.P., 2015. Discriminating disturbance from natural variation with LiDAR in semi-arid forests in the southwestern USA. Ecosphere, 6: 1-22. https://doi.org/10.1890/ES14-00384.1
Terrell, J.W., 1985. Proceedings of a workshop on fish habitat suitability index models. Fish and Wildlife Service, America.
Tian, S., Chen, X., Chen, Y., Xu, L. and Dai, X., 2009. Evaluating habitat suitability indices derived from CPUE and fishing effort data for Ommatrephes bratramii in the northwestern Pacific Ocean. Fish. Res., 95: 181-188. https://doi.org/10.1016/j.fishres.2008.08.012
Van der Lee G.E., Van der Molen D.T., Van den Boogaard H.F. and Van der Klis H., 2006. Uncertainty analysis of a spatial habitat suitability model and implications for ecological management of water bodies. Landsc. Ecol., 21: 1019-1032. https://doi.org/10.1007/s10980-006-6587-7
Vayghan, A.H., Poorbagher, H., Shahraiyni, H.T., Fazli, H. and Saravi, H.N., 2013. Suitability indices and habitat suitability index model of Caspian kutum (Rutilus frisii kutum) in the southern Caspian Sea. Aquat. Ecol., 47: 441-451. https://doi.org/10.1007/s10452-013-9457-9
Wan, R.J., Zhou, F., Shan, X.J. and Sun, S., 2010. Impacts of variability of habitat factors on species composition of ichthyoplankton and distribution of fish spawning ground in the Changjiang River estuary and its adjacent waters. Acta Ecol. Sin., 30: 155-165. https://doi.org/10.1016/j.chnaes.2010.04.006
Wang, D.X., Hong, B., Gan, J.P. and Xu, H.Z., 2010. Numerical investigation on propulsion of the counter-wind current in the northern South China Sea in winter. Deep Sea Res. Part I: Oceanogr. Res. Pap., 57: 1206-1221. https://doi.org/10.1016/j.dsr.2010.06.007
Wang, J., Zhang, T. and Fu, B., 2016. A measure of spatial stratified heterogeneity. Ecol. Indic., 67: 250-256. https://doi.org/10.1016/j.ecolind.2016.02.052
Wang, Y.F., Hu, Q.W., Yu, J., Chen, P.M. and Shu, L.M., 2019. Effect assessment of fishery resources proliferation in Zhelin Bay marine ranching in eastern Guangdong. S. China Fish. Sci., 15: 12-19 (in Chinese with English Abstract).
Wu, G.Z., 1989. The ecological characteristics of distribution of eggs, larvae and juveniles of the engraulis japonicus (Temminck and Schlegel) and anchoviella commersonii in the changjiang river estuary. Oceanol. Limnol. Sin., 20: 217-229 (in Chinese with English Abstract).
Xiao, G., Hu, Y., Li, N. and Yang, D., 2018. Spatial autocorrelation analysis of monitoring data of heavy metals in rice in China. Fd. Contr., 89: 32-37. https://doi.org/10.1016/j.foodcont.2018.01.032
Yan, R., Fan, J.T., Xu, S.N., Xu, Y.W., Sun, M.S. and Chen, Z.Z., 2018. Distribution characteristics of jack mackerel (Trachurus japonicus) habitat in the offshore waters of northern South China Sea. Chinese J. Ecol., 37: 2430-2435 (in Chinese with English Abstract).
Yen, K., Wang, G. and Lu, H., 2017. Evaluating habitat suitability and relative abundance of skipjack (Katsuwonus pelamis) in the Western and Central Pacific during various El Niño events. Ocean Coast. Manage., 139: 153-160. https://doi.org/10.1016/j.ocecoaman.2017.02.011
Yi, Y.J., Zhang, S.H. and Wang, Z.Y., 2013. The bedform morphology of Chinese sturgeon spawning sites in the Yangtze River. Int. J. Sediment Res., 28: 421-429. https://doi.org/10.1016/S1001-6279(13)60052-9
Yu J., Liu Z., Chen P. and Yao L., 2019c. Environmental factors affecting the spatiotemporal distribution of Decapterus maruadsi in the western Guangdong waters, China. Appl. Ecol. env. Res., 17: 8485-8499. https://doi.org/10.15666/aeer/1704_84858499
Yu, J., Hu, Q.W., Tang, D.L. and Chen, P.M., 2019a. Environmental effects on the spatiotemporal variability of purpleback flying squid in Xisha-Zhongsha waters, South China Sea. Mar. Ecol. Prog. Ser., 623: 25-37. https://doi.org/10.3354/meps13026
Yu, J., Hu, Q.W., Yuan H.R., and Chen, P.M., 2018c. Effect assessment of summer fishing moratorium in Daya Bay based on remote sensing data. S. China Fish. Sci., 14: 1-9 (in Chinese with English Abstract).
Yu, W. and Chen, X., 2018b. Ocean warming-induced range-shifting of potential habitat for jumbo flying squid Dosidicus gigas in the Southeast Pacific Ocean off Peru. Fish. Res., 204: 137-146. https://doi.org/10.1016/j.fishres.2018.02.016
Yu, W., Chen, X. and Zhang, Y., 2019b. Seasonal habitat patterns of jumbo flying squid Dosidicus gigas off Peruvian waters. J. mar. Syst., 194: 41-51. https://doi.org/10.1016/j.jmarsys.2019.02.011
Yu, W., Guo A., Zhang Y., Chen X., Qian W. and Li Y., 2018a. Climate-induced habitat suitability variations of chub mackerel Scomber japonicus in the East China Sea. Fish. Res., 207: 63-73. https://doi.org/10.1016/j.fishres.2018.06.007
Yu, W., Wen J., Zhang Z., Chen X. and Zhang Y., 2020. Spatio-temporal variations in the potential habitat of a pelagic commercial squid. J. mar. Syst., 206: 103339. https://doi.org/10.1016/j.jmarsys.2020.103339
Zhang, J., Zhang, P., Chen, Z.Z., Chen, G.B., Zhang, K., Xue, Y.W. and Sun, M.S., 2016. Biomass and distribution of carangoid fish resources in the offshore South China Sea. S. China Fish. Sci., 12: 38-48 (in Chinese with English Abstract).
Zhang, J.B. and Huang, Z.Y., 2003. An investigation on fish eggs and larvae in sea area around planning Yangjiang nuclear plant. J. Trop. Oceanogr., 22: 78-84 (in Chinese with English Abstract).
Zhang, R.Z., 1985. Fish eggs and larvae in the offshore waters of China. Shanghai Scientific and Technical Publishers, China. (in Chinses with English Abstract)
Zhao, X. and Jia, P., 2020. Towards sustainable small-scale fisheries in China: A case study of Hainan. Mar. Policy, in press. https://doi.org/10.1016/j.marpol.2020.103935
To share on other social networks, click on any share button. What are these?


