

Pinocembrin Ameliorates Neuronal Cell Death by Regulating Autoimmune Signals


Pinocembrin Ameliorates Neuronal Cell Death by Regulating Autoimmune Signals
Hairul Islam M. Ibrahim1,2, Abdalla A. Sayed1,3, Abdel Naser A. Ahmed4,5 and Emad A. Ahmed*1,6

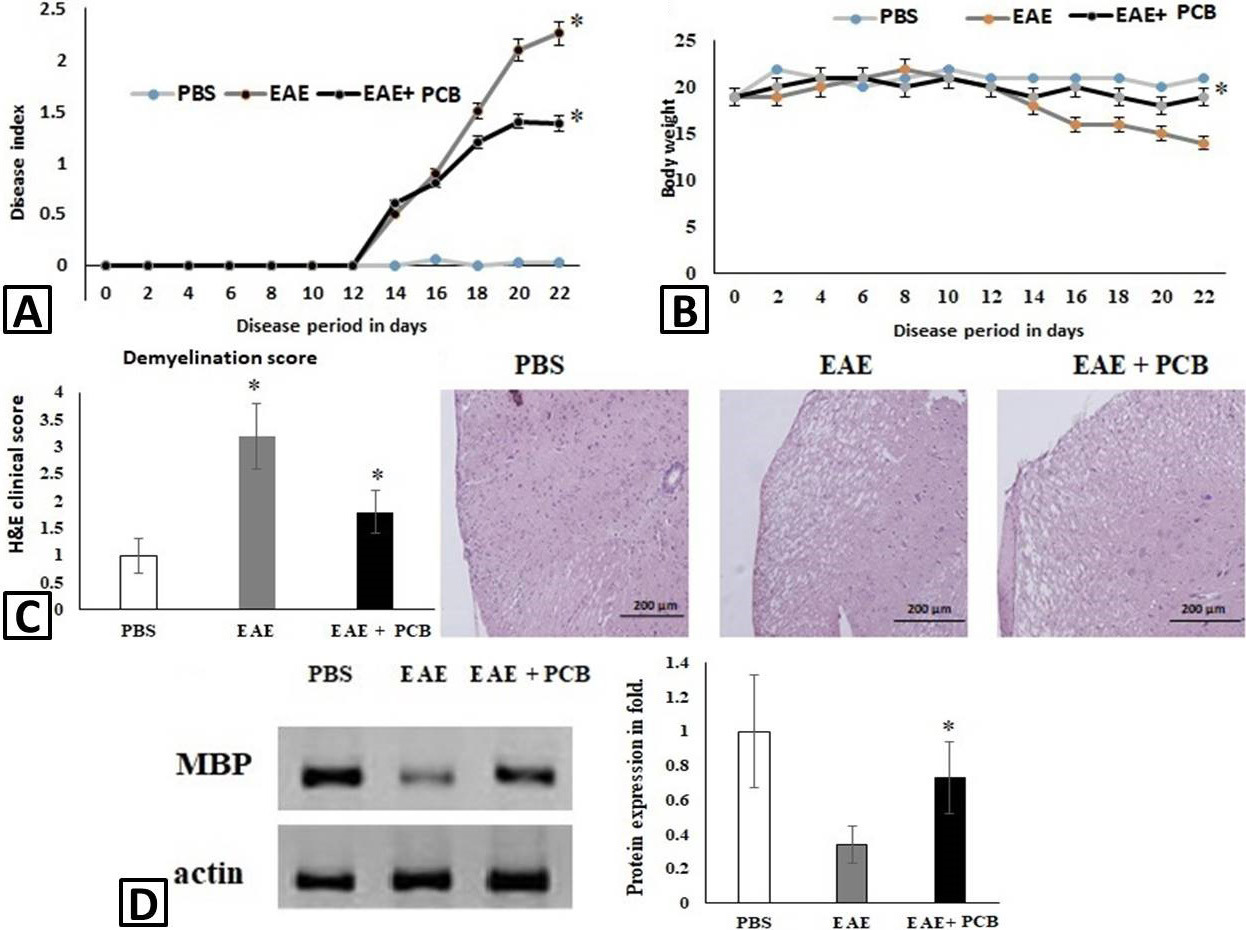
The effect of PCB (pinocembrin) on EAE (experimental autoimmune encephalomyelitis) mice in C57bl/6j mice model. Mice were immunized with MOG and pertusis toxin. From the day of immunization mice were received PCB 100mg/kg of mice body weight. A, clinical signs were graded as a described in material and methods; B, body weight; C, H&E of spinal cord; D, MBP immunoblot. Values are expressed using student t-test and one-way ANOVA (significant at p ≤ 0.05).
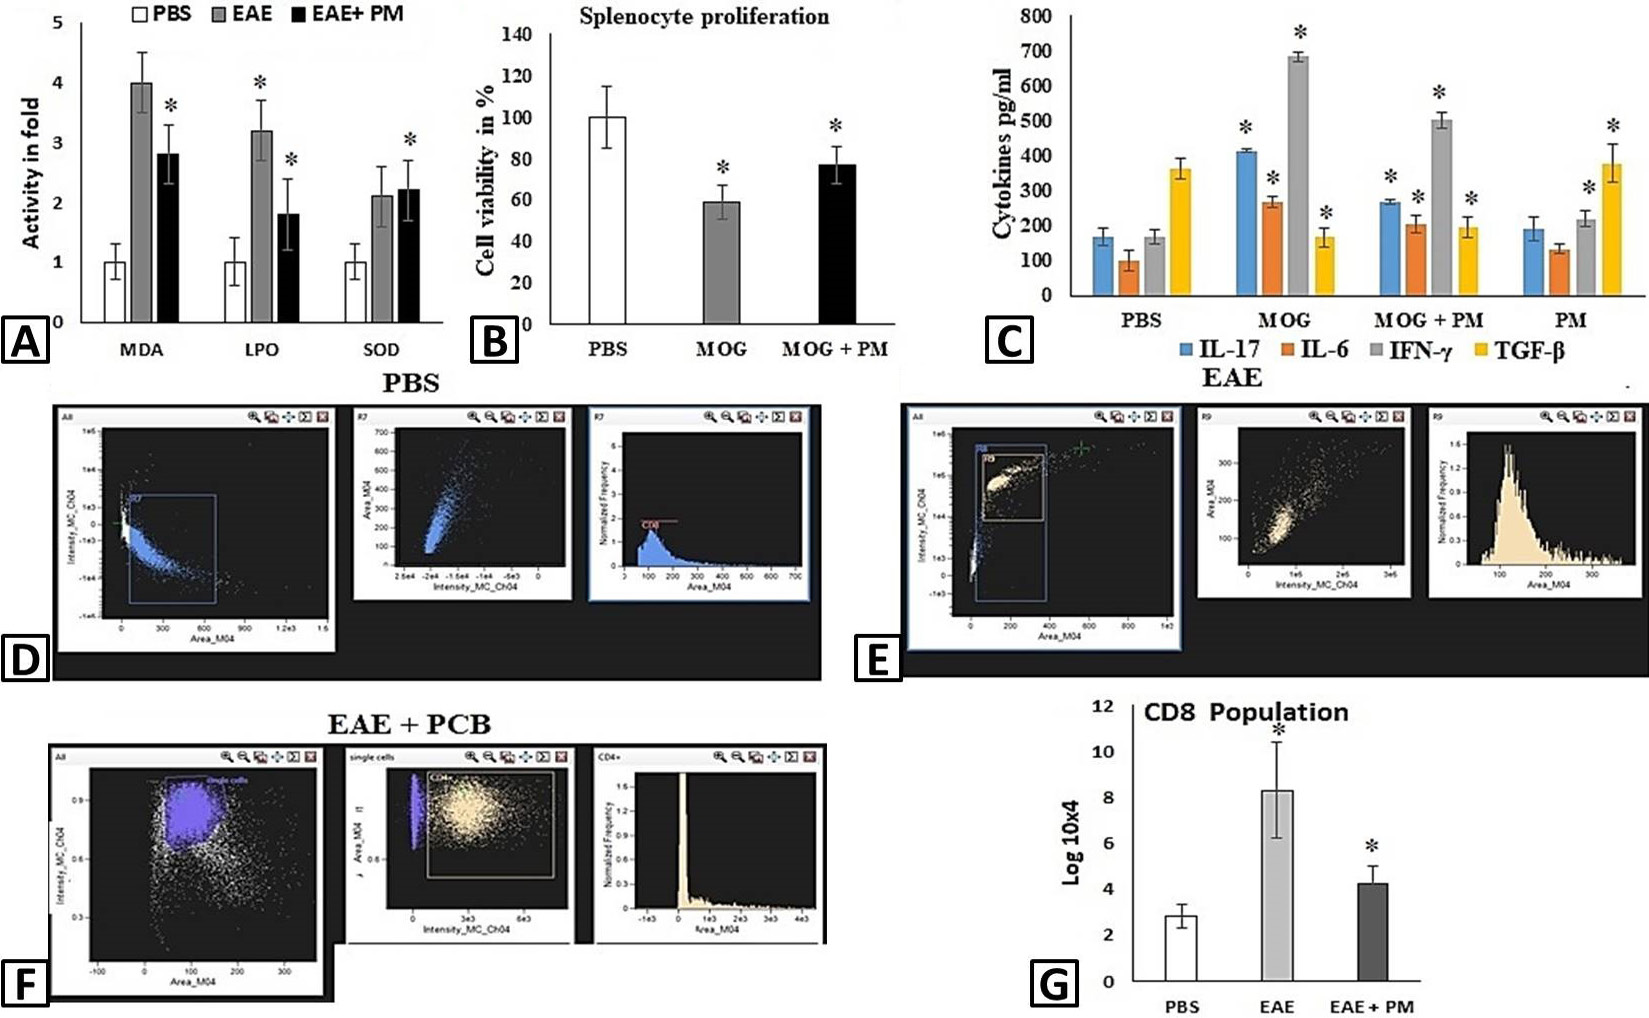
Biochemical assays in mice brain and CNS. The splenic cells from naïve mice were analyzed for proliferation and MOG challenged cytokines estimation. T-cell population were counted in PCB treated EAE mice. A, MDA, LPO and SOD activity were scored in PCB treated EAE mice; B, effect of PCB on cell viability of mice splenocytes; C, effect of PCB on MOG induced splenocytes cytokines level (IL-17, IL-6 IFN-γ and TGF-β) are quantified. For each group values were presented as mean ± SD. One way ANOVA followed by post hoc t-test were used for statistical analysis (significant at p ≤ 0.05).
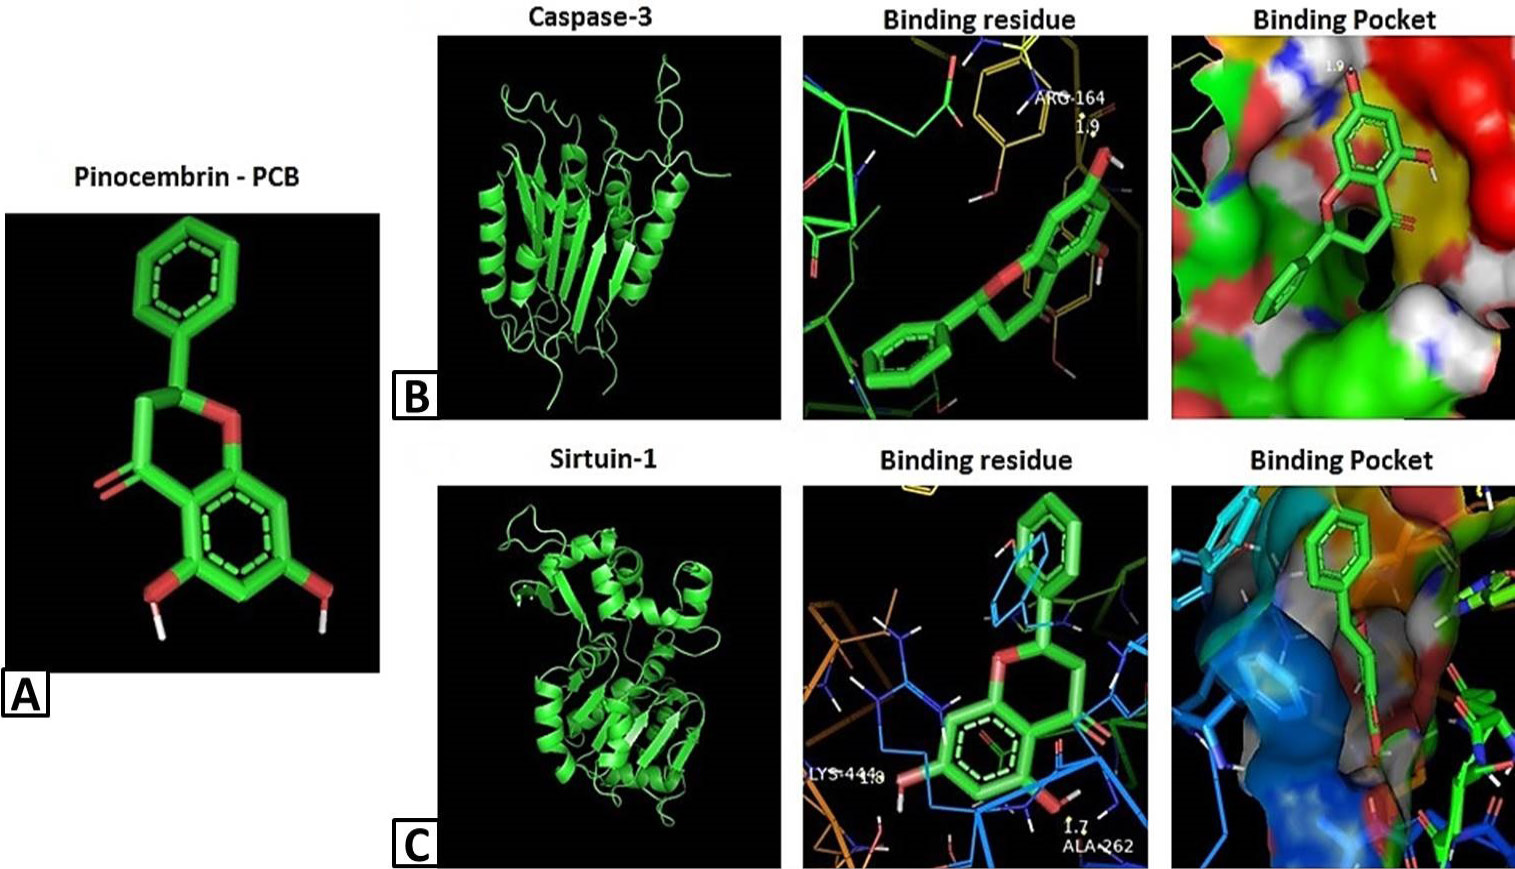
In silico evaluation of apoptogenic marker caspase-3 against PCB. A, 3D structure of PCB; B, 3D structure of caspase-3; C, PCB Docked with caspase 3 by two H-bond; D, arginine with cysteine; E, binding pockets of PCB against caspase 3. Docking was performed using autodoc4.2 software.
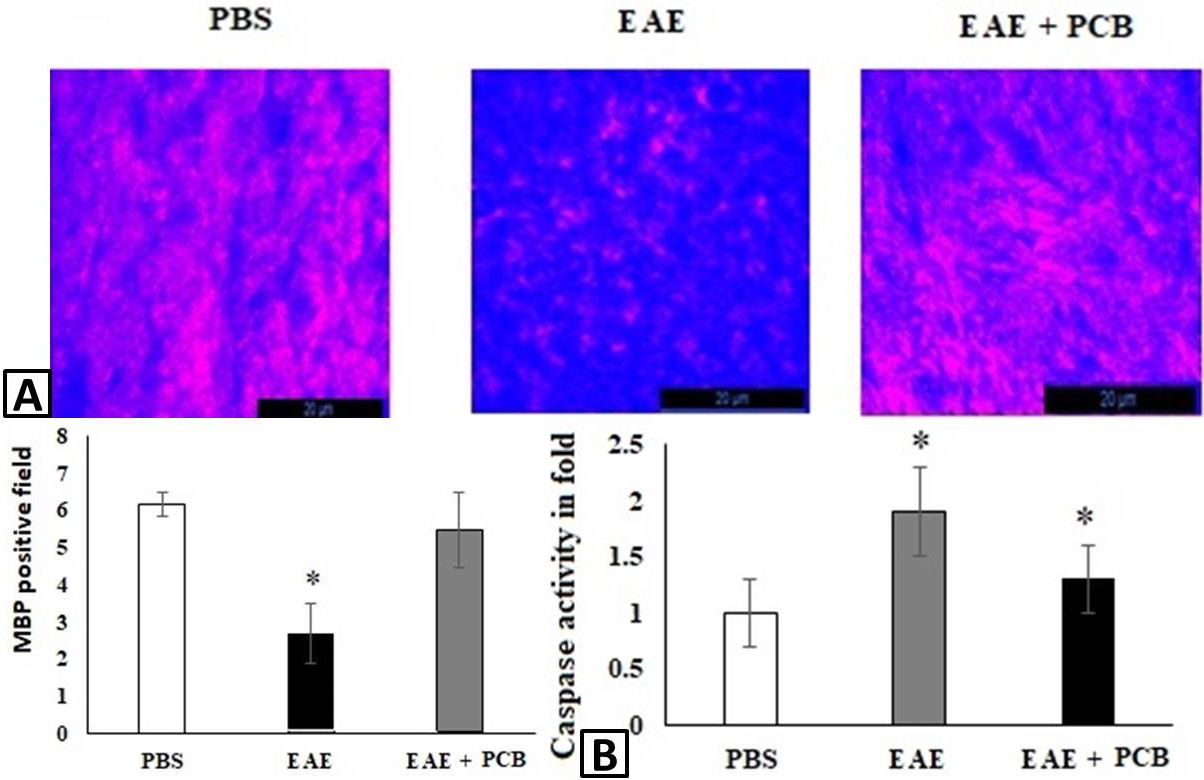
Immunofluorescence quantification of myelin basic protein to assess myelin sheath damage after 16 days post MOG induction. A, Myelin sheath marker MBP (red). The myelin damage in the subcortical white matter of spinal cord was alleviated in PCB group at 16 days of MOG induction; B, Caspase 3 activity to asses apoptotic marker in CNS. Significant improvement of cell damage observed at PCB treated groups. For each group values were presented as mean ± SD. One way ANOVA followed by post hoc t-test were used for statistical analysis (significant at p. ≤ 0.05).
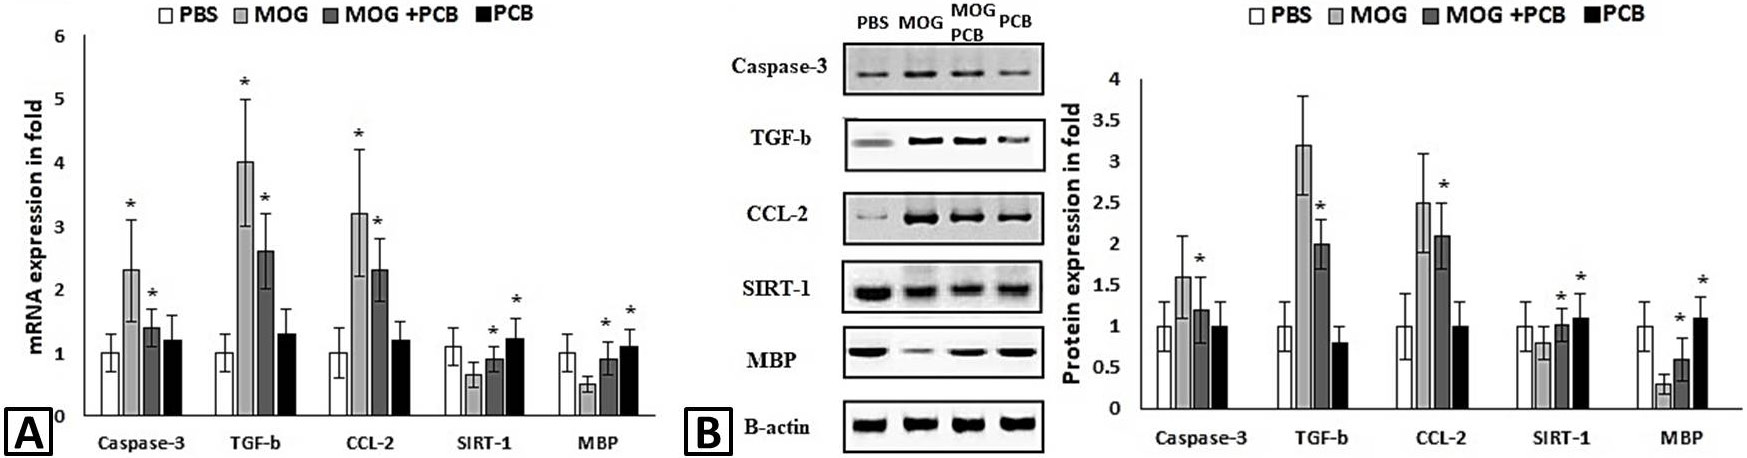
Expression level of caspase-3 TGF-β, CCL-2, SIRT-1, MBP mRNA and protein in vivo. A, mRNA of caspase-3, TGF-β, CCL-2 were downregulated in mouse model after PCB treatment. Whereas, SIRT1 and MBP were upregulated in PCB group compared with untreated EAE group; B, protein expression was observed similar like mRNA expression. GAPDH used as internal control for mRNA. Beta actin used as internal control for protein. For each group values were presented as mean ± SD. One way ANOVA followed by post hoc t-test were used for statistical analysis (significant at p. ≤ 0.05).


