

Monthly Variations in Proximate Composition, Fatty Acid Quality and Amino Acid Score of Warty Crab, Eriphia verrucosa (Forsskal, 1775) from the Southern Coast of Black Sea, Turkey


Monthly Variations in Proximate Composition, Fatty Acid Quality and Amino Acid Score of Warty Crab, Eriphia verrucosa (Forsskal, 1775) from the Southern Coast of Black Sea, Turkey
Barış Bayraklı
Departman of Aquaculture Program, Vocational Schools, Sinop University, Sinop, Turkey
ABSTRACT
In this study, monthly amino acid and fatty acid contents of warty crab (Eriphia verrucosa) were determined. From the southern coast of the Black Sea, fifty individuals of warty crab were caught every month. Amino acid score (AAS), chemical score (CS), and meal size amino acid score (MSAAS) were calculated. In August, when E. verrucosa breeds densely, the crude protein (%13.52) rate was found to be the lowest compared to other months. In September, the crude fat rate (1.07%) was found to be the lowest, and in August, moisture was the highest. Among the essential amino acids (EAA) determined during the study, lysine reached the highest value each month followed by leucine and isoleucine, respectively. On the other hand, among the non-essential amino acids (NEAA), aspartic acid and glutamic acid were the highest each month followed by glycine and alanine, respectively. The mean DHA/EPA ratio was calculated as 0.52 ± 0.031. Moreover, the ratio of ω-6:ω-3 ratio was determined as 1:2.92. AI, TI, PI, h/H, and FLQ indexes were calculated as 0.30, 0.22, 1.97, 3.52, and 25.50, respectively. E. verrucosa can be recommended for a healthy diet according to its high protein and low-fat content, high AAS, CS, MSAAS, EPA-DHA, and ω-3/ω-6 levels determined in this study. Furthermore, these values comply with the suggestions of World Health Organization (WHO).
Article Information
Received 18 March 2021
Revised 21 May 2021
Accepted 03 June 2021
Available online 07 July 2021
Key words
Amino acid, Amino acid score, Eriphia verrucosa, Fatty acid, Black Sea
DOI: https://dx.doi.org/10.17582/journal.pjz/20210318090304
* Corresponding author: bbayrakli@sinop.edu.tr
0030-9923/2021/0005-1729 $ 9.00/0
Copyright 2021 Zoological Society of Pakistan
INTRODUCTION
Aquatic foods are essential for a balanced and healthy diet due to their amino acid and omega fatty acid content. It was reported that in 2017, 96.4 million tonnes of aquatic products were captured globally (FAO, 2020). It is predicted that due to varying climate conditions, overfishing, and pollution, there will be no increase in capture rates (Tacon, 2002). In addition, there are ongoing studies regarding the population and nutritional composition of economically unimportant aquatic products in fishing areas.
Crabs constitute 2% of the global capture (FAO, 2020). In Turkey, merely 9.2 tonnes of crab were caught in the year 2019 (TurkStat, 2020). Compared to other species, the rate of crab capture in Turkey is almost nonexistent. Eriphia verrucosa, which may be among the essential aquatic products for the human diet, is of no commercial value in Turkey yet.
Shellfish are among the important aquatic resources globally, and their nutritional qualities have been proven by various studies (Barrento et al., 2010; Küçükgülmez and Çelik, 2008; Naczk et al., 2004; Soundarapandian et al., 2014; Wu et al., 2010). Some crab species (Cancer pagurus, Callinectes sapidus etc.) are very popular and consumed in Mediterranean countries (Barrento et al., 2010). It was reported that Eriphia verrucosa is found in all subregions of the Black Sea (Aydin et al., 2013). Warty crab is not commercially caught due to its small size and difficulty in the extraction of its meat. However, it has a potential commercial value in countries surrounding the Mediterranean Sea (Özdemir et al., 2017).
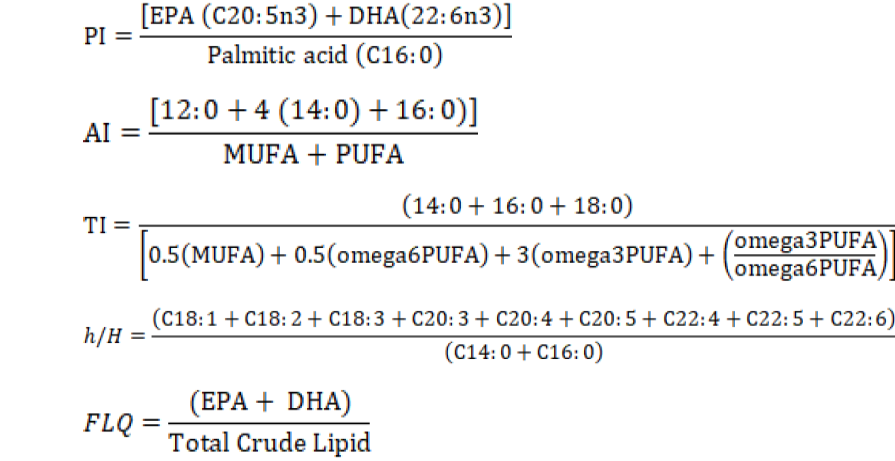
Presently, recommendations for a healthy and balanced diet are determined according to the amino acid and fatty acid qualities of food. Therefore, the World Health Organization reported the recommended values for essential amino acid intake (FAO/WHO, 2013). Thus, the amino acid score (AAS), the chemical score (CS), the meal size amino acid score (MSAAS) calculations were developed. Furthermore, other fatty acid quality assessment indexes such as polyene index (PI), which was developed by using the ratio of polyunsaturated fatty acids to other fatty acids, atherogenicity index (AI), thrombogenicity index (TI), hypocholesterolemic/hypercholesterolemic ratio (h/H), and fish lipid quality (FLQ) are also used.
In this study, it was aimed to determine the monthly nutritional composition, amino acid content, fatty acid content, and the quality of Eriphia verrucosa, a crab that is not considered as a commercial species, and thus to contribute to sustainable food and feedstuff products.
Sampling
From the southern coast of the Black Sea, fifty individuals of warty crab (E. verrucosa) with >5 cm carapace width were captured every month between July 2015 and June 2016. Crab samples were brought to the laboratory of Sinop University, Fisheries Faculty (Sinop, Turkey) on ice. The transportation time varied between 4 and 6 h depending on the field conditions and the distance of the sampling site. The edible meat from the claws and the body were removed and homogenized for subsequent analyses.
Proximate analysis
The wart crab meat was analyzed for proximate composition; crude protein by Kjeldahl (method 925.52), crude ash by heating at 550°C (method 923.03), moisture by air drying (method 925.10), according to the AOAC procedures (AOAC, 1995). Total fat analyzed by soxhlet method (AOAC, 2005).
Amino acid analysis
Total amino acids were hydrolyzed prior to the amino acid determination with HPLC. Homogenized meat of the crab was weighed and dried at 103 °C for 24 h until a constant weight of ± 0.10 mg difference was obtained (AOAC, 2005). Samples were weighed in a way to contain 30% protein. Prior to analyses, the incubator was set to 110 °C.
The samples were incubated for 24 h in 20 ml 6 N HCl, filtered through 0.20 µm PTFE syringe filters. The hydrochloric acid was evaporated at 65 °C by using a rotary evaporator. Dilution solution with citrate-sodium citrate buffer (0.1 M, pH 2.2) was added to the residue and thus the samples became ready for amino acid analyses (Chi et al., 2008; Millward, 2012; Oztekin et al., 2020). Amino acids were determined by HPLC (Arrieta and Prats-Moya, 2012). Samples were derivatized with OPA to be detected by an HPLC fluorescence detector. To achieve this, 4.5 ml of methanol containing 50 mg of OPA was added to 0.5 ml of borate buffer (pH 9.5). The derivatization solution was prepared by adding 50 µl of mercaptopropionic acid to this mixture. Amino acids were then derivatized with derivatization solution. Derivatives were determined by HPLC (column: 150 mm, 5 µm C18). Phosphate buffer (pH 7.3) and methanol: acetonitrile (9:1) solutions were employed for the developer phase. Measurements were carried out at Ex: 340 and Em: 425 nm wavelength. The spectrum obtained from 50 nmol standart amino acid. Within the study, 17 amino acid, that can be determined with HPCL, were investigated.
Determination of fatty acid composition
In fatty acid analyses, obtained crude fat was used as the material. To esterify, 0.150 g of crude fat was weighed in a volumetric flask and 5 ml of methanolic 0.5 N NaOH was added on top of it. Then, accompanied by a cooler, it was saponified by boiling in a water bath for 15 m with boiling chip addition. After flowing 5 ml of BF3 reagent over the cooler, it was boiled for 5 more minutes and 2 ml of heptane was added. Then, after another one minute of boiling, the cooler was removed and the sample was gently taken into a 25 ml volumetric flask. The flask was rinsed with saturated NaCl, and the resultant solution was also added. 1-2 ml of liquid was taken via micropipette from the upper heptane phase and transferred to a glass bottle with a test tube. A few crystalline anhydrous Na2SO4 was thrown into the bottle, 1 µl of this solution was injected into Shimadzu gas chromatography (GC) and the fatty acid composition was determined (Erickson, 1993).
The GC system consists of an FID detector (Flame Ionization Detector), gas chromatography (Shimadzu, GC2014, Japan), and autoinjector (AOC-20i, Shimadzu, Japan). The instrument is controlled by GC solution software (Version 2.41.00 su_1). FAME WAX (polyethylene glycol, 30 meter*0.25 mm I.D*0.2 µm, GC Columns Restek) was used as the chromatographic colon. GC operation conditions were as follows; injection mode: split ratio, split: 1/10, injection and detector temperature: 260 and 280 °C, carrier gas and column flow: Helium and 1.4 ml min-1, temperature program: initial temperature 5 m 100°C, 5°C increase per minute from 100°C to 150°C, 15 m at 150°C, 10°C increase per minute to 210°C, and 20 m at 210°C.
Peaks in gas chromatography by using the “Supelco 37 Component FAMEs Mix” standard. In obtaining data, methyl esters of fatty acids were calculated as the percentage of total fatty acids. The spectrum includes all commonly known fatty acid methyl esters.
The nutritional assessment was conducted according to the guidelines for the amino acid score (AAS) and egg protein amino acid score described by the Food and Agriculture Organization (FAO/WHO, 2013). The following equations were employed to calculate the amino acid score (AAS) and chemical score (CS):
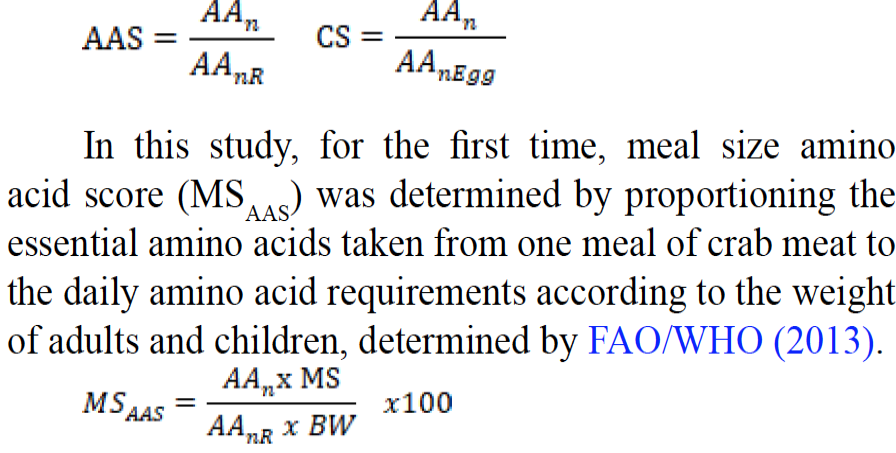
Where; n, the type of amino acid, of which score to be calculated (g/100 g ww was converted to mg/kg ww); nR, the type of reference amino acid, of which score to be calculated; nEgg, the type of whole egg amino acid, of which score to be calculated; MS, meal size for adults (227 g) and children (114 g) (Bayrakli, 2020; Naji et al., 2016); BW, body weight (kg) for adults (70 kg) and children (16 kg) (Bayrakli, 2020; Naji et al., 2016).
The polyene index (PI) was used as a measurement of PUFAs damage (Lubis and Buckle, 2007). Polyene index (PI), atherogenicity index (AI), thrombogenicity index (TI), hypocholesterolemic/hypercholesterolemic ratio (h/H), and fish lipid quality (FLQ) index were calculated according to formulas given below (Abrami et al., 1992; Caglak and Karsli, 2017; Fernández et al., 2007; Ulbricht and Southgate, 1991):
Data obtained in the study were subjected to One-Way ANOVA (analysis of variance) to compare means. To determine different groups, Tukey multiple comparison test was used. All statistical analyses were conducted by using PAST statistical software version 1.95 (Hammer et al., 2001). The significance level was set to P<0.05.
RESULTS AND DISCUSSION
Proximate analysis
The lowest moisture rate of warty crab was observed in March (78.32 ± 1.57%), and the highest in August (82.24 ± 2.64%). The highest crude protein rate was observed in June (16.91 ± 0.10%), and the lowest in August (13.52 ± 0.07%). The lowest crude fat rate was determined in September (1.07 ± 0.06%), and the highest was in May (1.67 ± 0.07%). The mean crude ash amount was found to be 2.40 ± 0.18%. The monthly differences between moisture, crude protein, and crude fat levels, which compose the nutritional composition of E. verrucosa meat, were found to be statistically significant (p<0.05). However, the differences between monthly crude ash values were statistically insignificant (p>0.05) (Table I). The warty crabs in the Black Sea breed during summer (Erkan et al., 2008). As the results indicate, the values of crude protein and crude fat, which were at the highest during early summer, decreased towards the end of the breeding season, and the lowest amounts were observed. On the contrary, the moisture rate increased towards the end of the breeding season. Although the nutritional composition of fish may vary depending on the sex, season, species, breeding season (Smoothey, 2013), temperature, feed availability, migratory behavior, and physiological differences (Barrento et al., 2010), the results of this study are similar to those of others (Ayas and Özoğul, 2011a, b; Durmus et al., 2018; Tureli et al., 2002).
Table I. Monthly proximate composition (g/100 g ww) of warty crab Eriphia verrucosa.
|
Months |
Moisture |
Crude protein |
Crude fat |
Crude ash |
|
January |
79.28 ± 2.37ab |
15.74 ± 0.13de |
1.23 ± 0.04ab |
2.24 ± 0.01a |
|
February |
79.55 ± 1.99ab |
15.53 ± 0.09de |
1.21 ± 0.05ab |
2.57 ± 0.05a |
|
March |
78.32 ± 1.57a |
16.46 ± 0.04f |
1.42 ± 0.06bc |
2.49 ± 0.12a |
|
April |
80.49 ± 1.52abc |
14.97 ± 0.04c |
1.14 ± 0.03a |
2.32 ± 0.09a |
|
May |
78.70 ± 1.40ab |
16.52 ± 0.12f |
1.67 ± 0.07c |
2.37 ± 0.48a |
|
June |
78.50 ± 1.11a |
16.91 ± 0.10g |
1.42 ± 0.11bc |
2.66 ± 0.09a |
|
July |
79.63 ± 3.01ab |
15.51 ± 0.04d |
1.45 ± 0.01bc |
2.36 ± 0.02a |
|
August |
82.24 ± 2.64c |
13.52 ± 0.07a |
1.19 ± 0.11ab |
2.29 ± 0.02a |
|
September |
81.00 ± 1.78bc |
14.51 ± 0.04b |
1.07 ± 0.06a |
2.30 ± 0.12a |
|
October |
79.39 ± 3.38ab |
15.86 ± 0.04de |
1.17 ± 0.04ab |
2.33 ± 0.15a |
|
November |
78.89 ± 1.59ab |
16.33 ± 0.20f |
1.44 ± 0.03bc |
2.29 ± 0.11a |
|
December |
79.19 ± 2.48ab |
15.88 ± 0.02e |
1.17 ± 0.13ab |
2.56 ± 0.05a |
|
Mean |
79.75 ± 2.58 |
15.64 ± 0.93 |
1.30 ± 0.18 |
2.40 ± 0.18 |
Different lowercase letters in the same column indicate significant differences between months (P<0.05).
Amino acids
In this study arginine as essential amino acid (EAA) was observed at the highest level each month followed by leucine and lysine, respectively. Whereas, as non essential amino acids (NEAA) aspartic acid was determined at the highest level each month followed by glutamic acid and glycine, respectively. According to the results of the studies conducted on various crab species in different regions, the dominant EAAs were determined as arginine, lysine, and leucine, while the NEAAs were determined as aspartic acid, glutamic acid, and glycine (Barrento et al., 2010; Naczk et al., 2004; Soundarapandian et al., 2014). The studies conducted on various crab species reported that the ratio of EAA/NEAA varies between 0.46 and 0.86 (Marques et al., 2010; Wu et al., 2010). In this study, this ratio varied between 0.48 and 0.76, and it indicates that the EAA/NEAA ratio may vary depending on the month (Table II). In addition, the amino acid composition values may vary according to region, breeding season, species, size, diet, and age (Duyar and Eke, 2009). Usually, more than 0.5 ratio of EAA to NEAA in seafood indicates a useful source of dietary proteins (Marques et al., 2010), and the ratio in warty crab meat was 0.59 on average throughout the year, which indicated that the warty crab is a valuable source of protein.
In this study, the highest lysine amount (1.42 ± 0.01 g/100g ww) was observed in December, and it was higher than the levels reported by Soundarapandaian et al. (2014) and Barrento et al. (2010), while it was lower than the amounts reported in the study of Naczsk et al.(2004), which were obtained from two different regions. However, the amount was similar to the study conducted by the latter, in different regions (Table III). The lysine value was observed to be much higher than 1 for adults and children (1.74 and 1.63 on average, respectively) throughout the year. In this study, lysine CS was observed as 1.12 ± 0.13 on average. According to FAO/WHO (2013), in the case of consuming E. verrucosa meat one meal a day, adults can obtain 86.98 ± 11.06%, and children can obtain 178.27 ± 19.99% of their daily requirements.
The lowest isoleucine value was observed in September (0.35 ± 0.01 g/100g) and the highest was in February (0.69 ± 0.01 g/100g ww). The values obtained from this study are lower than the results of Küçükgülmez and Çelik (2008) and Soundarapandian et al. (2014). However, they are similar to other studies. In this study, the mean isoleucine amino acid score in crab meat was found to be 1.19 ± 0.21 for adults and children, and it was determined to represent a significant amino acid in crab meat. The mean isoleucine CS value was determined as 0.66 ± 0.12%. It was determined that adults and children could obtain more than their daily requirement (60.38 ± 14.72, 131.45 ± 29.08% on average, respectively) when they consume one meal of warty crab meat a day throughout the year.
The lowest leucine amount was observed in April (0.71 ± 0.02 g/100g ww) and the lowest was in November (1.21 ± 0.09 g/100g ww), and the differences between months were statistically significant (p<0.05). As given in Table III, the leucine levels determined in various studies conducted on different species, were similar to the values determined in this study in November and December. However, the levels were higher during the remaining months. These differences can be explained by species, feeding habitat, region, and season. The mean leucine amino acid score was determined to be 1.01 ± 0.17 for adults and 0.98 ± 0.17 for children. Furthermore, leucine is a nutrient with a 0.91 ± 0.15 rate according to the CS value (Table IV). It was determined that adults can obtain 50.75 ± 8.86%, and children can obtain 107.36 ± 18.11% of their daily requirements when they consume one meal of E. verrucosa meat daily throughout the year. It was determined that crab meat is a valuable source of leucine.
Histidine plays an important role in the osmoregulatory process and is related to energy production. It is used in other metabolic pathways in case of an emergency and under certain rough conditions (Abe and Ohmama, 1987). Both histidine and arginine are substantial, particularly for children (FAO/WHO/UNU, 1985). In this study, the lowest histidine levels were observed in September (0.23 ± 0.03 g/100g ww) and the highest levels were observed in November (0.35 ± 0.01 g/100g ww), and the differences between months were statistically significant (p<0.05). When the studies conducted on different species were examined, the results obtained in this study were lower than the values reported by Soundarapandian et al. (2014), whereas, they were similar to those of others. The amino acid score for histidine throughout the year was observed as 1.26 ± 0.16 for adults, and 1.18 ± 0.15 for children. Moreover, the histidine CS rate was determined as 0.86 ± 0.11. Adults obtain 61.99 ± 8.37%, and children obtain 129.46 ± 19.35% of their daily requirement when they consume one meal of warty crab. E. verrucosa was determined to be a valuable source of histidine.
In this study, the highest threonine was observed in July as 0.32 ± 0.01 g/100g ww, and the mean threonine amount was determined to be 0.28 ± 0.04 g/100g throughout the year. The amount of threonine was observed to be lower in comparison with other studies. This difference can be due to species, feeding habitat, region, and season. The mean threonine score was determined to be 0.79 ± 0.11 for adults and 0.73 ± 0.10 for children, while the threonine CS rate was calculated as 0.39 ± 0.05. The study suggests that adults may obtain 39.96 ± 7.53%, and children may obtain 86.82 ± 13.68% of their daily requirement on average by eating one meal of crab meat daily.
Valine is involved in many metabolic activities, and it is regarded as indispensable for protein synthesis and growth (Wilson, 2002). In this study, the valine value was
Table II. Monthly amino acid content and amino acid groups of warty crab (g/100 g ww).
|
Jan |
Feb |
March |
Apr |
May |
Jun |
Jul |
Aug |
Sep |
Oct |
Nov |
Dec |
Mean |
|
|
Arg |
1.02 ± 0.07 ab |
0.87 ± 0.06 a |
1.08 ± 0.04 ab |
0.87 ± 0.05 a |
1.06 ± 0.04 ab |
1.39 ± 0.01 c |
1.34 ± 0.06 c |
1.23 ± 0.07bc |
1.00 ± 0.05 ab |
1.40 ± 0.05 c |
1.77 ± 0.09 d |
1.64 ± 0.03 d |
1.22 ± 0.29 |
|
His |
0.25 ± 0.05 a |
0.30 ± 0.02 a |
0.30 ± 0.02 a |
0.28 ± 0.02 a |
0.32 ± 0.00a |
0.25 ± 0.02a |
0.30 ± 0.04a |
0.26 ± 0.00a |
0.23 ± 0.03a |
0.28 ± 0.02a |
0.35 ± 0.01a |
0.32 ± 0.02a |
0.29 ± 0.04 |
|
Ile |
0.66 ± 0.03 fg |
0.69 ± 0.01 g |
0.63 ± 0.02 defg |
0.54 ± 0.01 bcd |
0.64 ± 0.01efg |
0.51 ± 0.01bc |
0.58 ± 0.03cdef |
0.36 ± 0.01a |
0.35 ± 0.03a |
0.57 ± 0.02bcdef |
0.55 ± 0.02bcde |
0.47 ± 0.05b |
0.55 ± 0.11 |
|
Leu |
0.81 ± 0.03 ab |
0.85 ± 0.01 abc |
0.93 ± 0.04 bc |
0.71 ± 0.02 a |
0.91 ± 0.00bc |
0.80 ± 0.02ab |
0.85 ± 0.01abc |
0.99 ± 0.00cd |
0.71 ± 0.01a |
0.96 ± 0.00c |
1.21 ± 0.09d |
1.13 ± 0.08d |
0.91 ± 0.15 |
|
Lys |
1.15 ± 0.02 a |
1.10 ± 0.04 a |
1.20 ± 0.02 ab |
1.08 ± 0.08 a |
1.11 ± 0.03a |
1.09 ± 0.02a |
1.14 ± 0.00a |
1.31 ± 0.03bc |
1.09 ± 0.05a |
1.19 ± 0.03ab |
1.33 ± 0.03bc |
1.42 ± 0.01c |
1.18 ± 0.11 |
|
Met |
0.39 ± 0.02 a |
0.36 ± 0.01 a |
0.38 ± 0.03 a |
0.38 ± 0.02 a |
0.38 ± 0.01a |
0.39 ± 0.01a |
0.37 ± 0.03a |
0.37 ± 0.01a |
0.39 ± 0.02a |
0.42 ± 0.01a |
0.54 ± 0.04b |
0.44 ± 0.04a |
0.40 ± 0.05 |
|
Phe |
0.47 ± 0.02 a |
0.48 ± 0.01 a |
0.51 ± 0.02 a |
0.42 ± 0.03 a |
0.49 ± 0.01a |
0.45 ± 0.03a |
0.48 ± 0.03a |
0.46 ± 0.02a |
0.43 ± 0.00a |
0.48 ± 0.01a |
0.60 ± 0.04c |
0.48 ± 0.01ab |
0.48 ± 0.05 |
|
Thr |
0.32 ± 0.03 ab |
0.30 ± 0.01 ab |
0.30 ± 0.01 ab |
0.26 ± 0.02 ab |
0.29 ± 0.01ab |
0.23 ± 0.03a |
0.32 ± 0.01ab |
0.23 ± 0.02b |
0.25 ± 0.03ab |
0.32 ± 0.03b |
0.23 ± 0.04a |
0.27 ± 0.02ab |
0.28 ± 0.04 |
|
Ala |
0.85 ± 0.01 a |
1.00 ± 0.06 bcd |
1.03 ± 0.04 cde |
0.88 ± 0.06 ab |
0.99 ± 0.01abcd |
1.06 ± 0.04cde |
0.99 ± 0.03abcd |
0.96 ± 0.04abcd |
0.99 ± 0.00bcd |
0.95 ± 0.02abc |
1.10 ± 0.05de |
1.16 ± 0.02e |
1.00 ± 0.09 |
|
Asp |
2.97 ± 0.01 bcd |
2.97 ± 0.13 bcd |
3.33 ± 0.09 ef |
3.01 ± 0.09 bcde |
3.52 ± 0.01f |
4.00 ± 0.11e |
3.11 ± 0.16cde |
2.18 ± 0.06a |
3.20 ± 0.01def |
2.99 ± 0.10bcde |
2.84 ± 0.10bc |
2.69 ± 0.03b |
3.07 ± 0.44 |
|
Glu |
3.04 ± 0.10 d |
2.91 ± 0.10 d |
2.78 ± 0.03 d |
2.96 ± 0.08 d |
2.85 ± 0.16d |
2.78 ± 0.06d |
2.29 ± 0.03c |
1.54 ± 0.01a |
2.46 ± 0.02c |
2.39 ± 0.02c |
1.95 ± 0.09b |
1.71 ± 0.11ab |
2.47 ± 0.50 |
|
Gly |
1.47 ± 0.08 bc |
1.30 ± 0.02 abc |
1.44 ± 0.01 bc |
1.48 ± 0.03 bc |
1.60 ± 0.15c |
1.57 ± 0.11c |
1.27 ± 0.05abc |
1.07 ± 0.06a |
1.22 ± 0.03ab |
1.44 ± 0.01bc |
1.33 ± 0.06abc |
1.44 ± 0.17bc |
1.39 ± 0.16 |
|
Orn |
0.25 ± 0.02 bc |
0.26 ± 0.01 bcd |
0.31 ± 0.01 de |
0.15 ± 0.01 a |
0.13 ± 0.01a |
0.11 ± 0.00a |
0.21 ± 0.01b |
0.37 ± 0.03e |
0.30 ± 0.03cd |
0.23 ± 0.01b |
0.22 ± 0.01b |
0.25 ± 0.00bc |
0.23 ± 0.08 |
|
Ser |
0.48 ± 0.04 a |
0.52 ± 0.02 a |
0.54 ± 0.02 ab |
0.48 ± 0.02 a |
0.52 ± 0.02a |
0.50 ± 0.02a |
0.51 ± 0.08a |
0.53 ± 0.00ab |
0.49 ± 0.01a |
0.52 ± 0.00a |
0.57 ± 0.01ab |
0.65 ± 0.04b |
0.53 ± 0.05 |
|
Tau |
0.32 ± 0.15 a |
0.31 ± 0.06 a |
0.31 ± 0.01 a |
0.24 ± 0.02 a |
0.32 ± 0.01a |
0.50 ± 0.09a |
0.38 ± 0.07a |
0.38 ± 0.04a |
0.28 ± 0.01a |
0.29 ± 0.02a |
0.38 ± 0.02a |
0.39 ± 0.01a |
0.34 ± 0.08 |
|
Tyr |
0.44 ± 0.01 bc |
0.42 ± 0.01 bc |
0.41 ± 0.03 bc |
0.37 ± 0.01 ab |
0.47 ± 0.00bc |
0.40 ± 0.02abc |
0.46 ± 0.02bc |
0.39 ± 0.03abc |
0.32 ± 0.05a |
0.48 ± 0.01c |
0.41 ± 0.04abc |
0.42 ± 0.02bc |
0.42 ± 0.05 |
|
Val |
0.31 ± 0.01 ab |
0.32 ± 0.02 ab |
0.32 ± 0.01 ab |
0.25 ± 0.03 a |
0.29 ± 0.01ab |
0.26 ± 0.01ab |
0.29 ± 0.03ab |
0.30 ± 0.01ab |
0.24 ± 0.05a |
0.31 ± 0.01ab |
0.27 ± 0.00ab |
0.35 ± 0.03b |
0.29 ± 0.03 |
|
EAA |
5.37 ± 0.18 bcd |
5.27 ± 0.07 bc |
5.65 ± 0.01 cd |
4.81 ± 0.02 ab |
5.48 ± 0.08cd |
5.36 ± 0.03bc |
5.69 ± 0.10cd |
5.52 ± 0.14cd |
4.69 ± 0.04a |
5.94 ± 0.14de |
6.85 ± 0.28f |
6.51 ± 0.27f |
5.60 ± 0.61 |
|
NEAA |
9.92 ± 0.09 ef |
9.83 ± 0.03 de |
10.33 ± 0.05 fg |
9.71 ± 0.09 de |
10.55 ± 0.05g |
11.07 ± 0.1h |
9.37 ± 0.17cd |
7.59 ± 0.06a |
9.41 ± 0.01cd |
9.46 ± 0.09cd |
9.00 ± 0.07bc |
8.91 ± 0.29b |
9.60 ± 0.88 |
|
EAA /NEAA |
0.54 |
0.54 |
0.55 |
0.50 |
0.52 |
0.48 |
0.61 |
0.73 |
0.50 |
0.63 |
0.76 |
0.73 |
0.59 |
|
EAA/ TAA |
35.12 |
34.91 |
35.36 |
33.14 |
34.20 |
32.63 |
37.77 |
42.09 |
33.28 |
38.55 |
43.19 |
42.22 |
36.87 |
|
NEAA /TAA |
64.90 |
65.09 |
64.64 |
66.86 |
65.80 |
67.37 |
62.23 |
57.91 |
66.72 |
61.45 |
56.81 |
57.78 |
63.13 |
|
SAA |
0.39 ± 0.02 |
0.36 ± 0.01 |
0.38 ± 0.03 |
0.38 ± 0.02 |
0.38 ± 0.01 |
0.39 ± 0.01 |
0.37 ± 0.03 |
0.37 ± 0.01 |
0.39 ± 0.02 |
0.42 ± 0.01 |
0.54 ± 0.04 |
0.44 ± 0.04 |
0.40 ± 0.05 |
|
ArAA |
0.91 ± 0.03 |
0.90 ± 0.01 |
0.92 ± 0.01 |
0.80 ± 0.02 |
0.96 ± 0.00 |
0.85 ± 0.04 |
0.95 ± 0.05 |
0.85 ± 0.05 |
0.74 ± 0.05 |
0.96 ± 0.02 |
1.01 ± 0.00 |
0.90 ± 0.03 |
0.90 ± 0.08 |
|
DAA |
8.32 ± 0.16 |
8.18 ± 0.06 |
8.58 ± 0.07 |
8.33 ± 0.15 |
8.96 ± 0.01 |
9.41 ± 0.02 |
7.66 ± 0.21 |
5.76 ± 0.15 |
7.87 ± 0.06 |
7.77 ± 0.12 |
7.21 ± 0.01 |
6.99 ± 0.33 |
7.92 ± 0.95 |
|
DAA /TAA |
54.35 |
54.18 |
53.71 |
57.36 |
55.88 |
57.25 |
50.83 |
43.91 |
55.80 |
50.48 |
45.51 |
45.35 |
52.05 |
|
FAA |
10.13 ± 0.00 |
9.69 ± 0.08 |
10.35 ± 0.06 |
9.79 ± 0.20 |
10.78 ± 0.05 |
11.33 ± 0.06 |
9.69 ± 0.27 |
7.78 ± 0.01 |
9.30 ± 0.05 |
10.09 ± 0.04 |
10.04 ± 0.25 |
9.47 ± 0.18 |
9.87 ± 0.85 |
|
FAA /TAA |
66.18 |
64.13 |
64.81 |
67.41 |
67.25 |
68.91 |
64.36 |
59.35 |
65.91 |
65.51 |
63.38 |
61.41 |
64.88 |
|
TAAA |
6.01 ± 0.88 |
5.89 ± 0.02 |
6.11 ± 0.12 |
5.97 ± 0.18 |
6.38 ± 0.14 |
6.78 ± 0.05 |
5.39 ± 0.19 |
3.72 ± 0.05 |
5.66 ± 0.03 |
5.38 ± 0.12 |
4.79 ± 0.01 |
4.40 ± 0.14 |
5.54 ± 0.85 |
|
TBAA |
2.42 ± 0.04 |
2.27 ± 0.04 |
2.58 ± 0.04 |
2.24 ± 0.01 |
2.49 ± 0.07 |
2.72 ± 0.01 |
2.78 ± 0.02 |
2.81 ± 0.010 |
2.32 ± 0.07 |
2.87 ± 0.07 |
3.44 ± 0.13 |
3.37 ± 0.06 |
2.69 ± 0.39 |
|
TBCAA |
1.78 ± 0.06 |
1.86 ± 0.02 |
1.88 ± 0.03 |
1.50 ± 0.00 |
1.84 ± 0.00 |
1.57 ± 0.04 |
1.73 ± 0.06 |
1.65 ± 0.00 |
1.30 ± 0.09 |
1.83 ± 0.03 |
2.03 ± 0.11 |
1.95 ± 0.16 |
1.75 ± 0.21 |
Different lowercase letters in the same row indicate significant differences between months (P<0.05).
Thr, threonine; Orn, ornithine; Val, valine; Met, methionine; Ile, isoleucine; Leu, leucine; Phe, phenylalanine; His, histidine; Lys, lysine; Arg, arginine; Asp, aspartic acid; Ser, serine; Glu, glutamic acid; Gly, glycine; Ala, alanine; Tyr, tyrosine; Tau, taurine; EAA, essential amino acids; NEAA, non-essential amino acids; TAA, total amino acids; SAA, sulfur amino acids= methionine; ArAA, aromatic amino acids= phenylalanine+ tyrosine; DAA, Delicious amino acids= alanine+glutamic acid+aspartic acid+glycine; FAA, Functional amino acids= arginine+methionine+ leucine+tyrosine+glutamic acid+aspartic acid+glycine; TAAA, Total Acidic amino acids= glutamic acid+aspartic acid; TBAA, Total Basic amino acids= arginine+histidine+ lysine; TBCAA, Total branched chain amino acids= isoleucine+ leucine+valine.
Table III. The amino acid values for various crabs in different regions (g/ 100 g ww).
|
Species |
Region |
Arg |
His |
Ile. |
Met |
Phe |
Thr |
Val |
Ref |
||
|
C. sapidus |
Adana/Turkey |
1.58 |
0.45 |
0.94 |
0.59 |
0.74 |
1.05 |
0.93 |
1 |
||
|
C. natator |
♂ |
Parangipettai |
0.90 |
1.88 |
1.95 |
1.21 |
0.46 |
0.51 |
0.14 |
2 |
|
|
C. natator |
♀ |
Parangipettai |
0.80 |
1.45 |
1.75 |
1.06 |
0.35 |
0.48 |
0.13 |
2 |
|
|
M. brach ydactyla |
♀ |
Scottish coast |
1.57 |
0.29 |
0.68 |
0.30 |
0.57 |
0.74 |
0.71 |
3 |
|
|
C. pagurus |
♀ |
Scottish coast |
1.64 |
0.36 |
0.67 |
0.18 |
0.63 |
0.99 |
0.69 |
4 |
|
|
C. pagurus |
♀ |
English canal |
1.67 |
0.35 |
0.68 |
0.19 |
0.63 |
0.98 |
0.70 |
4 |
|
|
C. pagurus |
♂ |
Scottish coast |
1.79 |
0.40 |
0.75 |
0.26 |
0.70 |
1.06 |
0.77 |
4 |
|
|
C. pagurus |
♂ |
English canal |
1.63 |
0.35 |
0.70 |
0.24 |
0.63 |
0.94 |
0.70 |
4 |
|
|
P. pelagicus |
♀ |
Hainan Island |
1.77 |
0.48 |
0.86 |
0.46 |
0.77 |
0.66 |
1.03 |
5 |
|
|
P. pelagicus |
♂ |
Hainan Island |
1.74 |
0.38 |
0.70 |
0.42 |
0.66 |
0.62 |
0.80 |
5 |
|
|
E. sinensis |
Yancu Lake/ China |
1.78 |
0.43 |
0.78 |
0.23 |
0.78 |
0.86 |
0.86 |
6 |
||
|
C. maenas |
Antigonish/Canada |
1.53 |
0.42 |
0.83 |
0.61 |
0.71 |
0.80 |
0.85 |
7 |
||
|
C. maenas |
Pomquet/Canada |
1.48 |
0.39 |
0.74 |
0.59 |
0.64 |
0.76 |
0.73 |
7 |
||
|
C. maenas |
Merigomish/Canada |
1.29 |
0.41 |
0.78 |
0.42 |
0.66 |
0.76 |
0.77 |
7 |
||
|
C. maenas |
Canso/Canada |
1.93 |
0.50 |
0.97 |
0.70 |
0.68 |
0.93 |
0.97 |
7 |
||
|
E. verrucosa |
Sinop/Turkey |
0.87-1.77 |
0.23-0.35 |
0.38-0.69 |
0.36-0.54 |
0.43-0.60 |
0.23-0.32 |
0.24-0.35 |
8 |
||
|
Ala |
Asp |
Glu |
Tau |
Tyr |
∑EAA |
∑NEAA |
EAA/ NEAA |
||||
|
C. sapidus |
Adana/Turkey |
0.70 |
1.61 |
1.61 |
0.67 |
7.31 |
9.28 |
0.79 |
1 |
||
|
C. natator |
♂ |
Parangipettai |
0.14 |
1.98 |
1.98 |
0.98 |
7.53 |
11.03 |
2 |
||
|
C. natator |
♀ |
Parangipettai |
0.05 |
1.75 |
1.75 |
0.85 |
7.48 |
8.12 |
2 |
||
|
M. brach ydactyla |
♀ |
Scottish coast |
0.94 |
1.35 |
1.35 |
0.36 |
0.53 |
6.87 |
7.99 |
0.86 |
3 |
|
C. pagurus |
♀ |
Scottish coast |
0.91 |
1.49 |
1.49 |
0.33 |
0.62 |
0.80 |
4 |
||
|
C. pagurus |
♀ |
English canal |
0.93 |
1.54 |
1.54 |
0.34 |
0.63 |
0.80 |
4 |
||
|
C. pagurus |
♂ |
Scottish coast |
0.98 |
1.79 |
1.79 |
0.43 |
0.71 |
0.81 |
4 |
||
|
C. pagurus |
♂ |
English canal |
0.92 |
1.63 |
1.63 |
0.50 |
0.66 |
0.80 |
4 |
||
|
P. pelagicus |
♀ |
Hainan Island |
1.24 |
1.42 |
1.42 |
0.00 |
0.72 |
7.93 |
9.39 |
5 |
|
|
P. pelagicus |
♂ |
Hainan Island |
1.03 |
1.34 |
1.34 |
0.00 |
0.64 |
6.43 |
9.08 |
5 |
|
|
E. sinensis |
Yancu Lake / China |
1.25 |
1.79 |
1.79 |
0.63 |
6 |
|||||
|
C. maenas |
Antigonish / Canada |
1.16 |
1.77 |
1.77 |
0.62 |
7 |
|||||
|
C. maenas |
Pomquet/ Canada |
0.95 |
1.66 |
1.66 |
0.60 |
7 |
|||||
|
C. maenas |
Merigomish/ Canada |
0.96 |
1.89 |
1.89 |
0.58 |
7 |
|||||
|
C. maenas |
Canso/Canada |
1.23 |
2.09 |
2.09 |
0.74 |
7 |
|||||
|
E. verrucosa |
Sinop/Turkey |
0.85-1.16 |
2.18-3.52 |
1.54-3.04 |
0.36-0.54 |
0.32-0.48 |
4.69-6.85 |
7.59-11.07 |
0.48- 0.76 |
8 |
References: 1, Küçükgülmez and Çelik (2008); 2, Soundarapandian et al. (2014); 3, Marques et al. (2010); 4, Barrento et al. (2010); 5: Wu et al. (2010); 6, Chen et al. (2007); 7, Naczk et al. (2004); 8, The present study.
the highest in December (0.35 ± 0.01 g/100g ww) and was determined to be lower than the values shown in Table II. Valine is determined as the 1st barrier amino acid in E. verrucosa meat. The valine amino acid score was determined as 0.50 ± 0.06 for adults and 0.48 ± 0.06 for children, whereas the CS was calculated as 0.29 ± 0.04. It is determined that adults may obtain 24.92 ± 4.03%, and children may obtain 53.11 ± 7.73% of their daily requirement when that they consume one meal of crab meat a day.
Table IV. Monthly AAS, CS and MSAAS values of warty crab for adults and children.
|
FAO/WHO (2013) |
AAS |
CS |
MSAAS |
|||||
|
Adult |
Child |
Whole egg |
Adult |
Child |
Adult |
Adult |
Child |
|
|
ArAA |
25 |
30 |
93 |
|||||
|
His |
10 |
12 |
22 |
|||||
|
Ile |
20 |
22 |
54 |
1.19 ± 0.21 |
||||
|
Leu |
39 |
44 |
70 |
|||||
|
Lys |
30 |
35 |
66 |
1.74 ± 0.21 |
1.63 ± 0.20 |
1.12 ± 0.13 |
86.98 ± 11.06 |
178.27 ± 19.99 |
|
SAA |
15 |
17 |
57 |
0.46 ± 0.05 |
||||
|
Thr |
15 |
18 |
47 |
|||||
|
Val |
26 |
29 |
60 |
0.48 ± 0.06 |
0.29 ± 0.04 |
|||
Methionine and cysteine are among the sulfur amino acids (SAA). In this study, the cysteine amino acid could not be determined. Thus, the methionine value was selected as the SAA. Methionine was found to be the highest in November (0.54 ± 0.01 g/100g). It was higher than the results of Barrento et al. (2010), Chen et al. (2007) and lower than the value reported by Soundarapandian et al.(2014). The results were similar to those of other studies. The mean SAA score was determined as 1.20 ± 0.14 for adults and 1.15 ± 0.13 for children, whereas the SAA CS was calculated as 0.46. It is determined that adults may obtain 61.75 ± 14.58%, and children may obtain 125.35 ± 16.20% of their daily requirement by eating one meal of crab meat a day.
Aromatic amino acids (ArAA), composed of phenylalanine and tyrosine, are efficient particularly in lowering hypertension (Teymoori et al., 2018). In this study, the highest level of phenylalanine was observed in November (0.60 ± 0.01 g/100g ww), and this value was similar to the values specified in the literature (Table III). In this study, the tyrosine level was observed to be 0.48 ± 0.01 g/100g in October and was lower than the level reported by Soundarapandian et al. (2014). However, the value showed similarity to the results of others. In this study, the ArAA score was determined as 1.55 ± 0.12 for adults and 1.44 ± 0.11 for children. ArAA CS was determined as 0.64 ± 0.05. It was observed that adults may obtain 76.51 ± 6.56%, and children may obtain 158.16 ± 17.34% of their daily requirement when they consume one meal of E. verrucosa.
Glutamic acid, aspartic acid, alanine, and glycine compose total delicious amino acids (DAA). The lowest DAA was observed in August (5.76 g/100g ww) and the highest was in June (9.41 g/100g ww). The differences between months were statistically significant (p<0.05). It is suggested that the taste of E. verrucosa meat varies depending on the month, and this change is considered to be caused by the diet of the crab, breeding season, water temperature, and climate. Functional amino acids (FAA) regulate gene expression, enhance the growth of the small intestine and the skeletal muscles, and play an active role in preventing the body from producing excess fat tissue (Wu, 2013). FAA was determined to be the lowest in August (7.78 g/100g ww) and the highest in June (11.33 g/100g ww). Moreover, the mean FAA value was calculated as 9.87 g/100g.
Total basic amino acids (TBAA) were observed to be the lowest in April (2.24 g/100g ww) and the highest in November (3.44 g/100g ww). Total acidic amino acids (TAAA) were observed to be the lowest in August (3.72 g/100g ww) and the highest in June (6.78 g/100g ww). It was observed that crab meat has a more acidic amino acid structure. Reports are showing a relation between total branched chain amino acids (TBCAA) and cardiometabolic risk factors, diabetes mellitus, obesity, body composition, frailty, longevity, muscle turnover, and sarcopenia (Le Couteur et al., 2020). TBCAA was observed to be the lowest in September (1.30 g/100g ww) and the highest in November (2.03 g/100g ww).
Fatty acids
Several studies have reported that various species of crabs display a 15.7-26.2% value of saturated fatty acids (SFA), and similar to this study, contain palmitic acid (C16:0) and stearic acid as dominant fatty acids (Ayas and Özoğul, 2011a; Barrento et al., 2010; Wu et al., 2010). The results of this study showed that the SFA levels vary depending on the month. The lowest SFA was determined in September (24.62 ± 0.04%) and the highest was in March (35.84 ± 0.80%), while the difference between these months was statistically significant (p<0.05). It was determined that, during excessive feeding periods, the total amount of SFA observed in this study was higher than the values specified in the literature. However, as the breeding season begins, the values were similar to the results of others.
Table V. Monthly fatty acid values of warty crab.
|
|
Jan |
Feb |
Mar |
Apr |
May |
Jun |
Jul |
Aug |
Sep |
Oct |
Nov |
Dec |
Mean |
|
C14:0 |
1.07 ± 0.02c |
0.60 ± 0.08ab |
1.60 ± 0.05d |
0.83 ± 0.01bc |
1.91 ± 0.23e |
1.07 ± 0.07c |
0.85 ± 0.00bc |
1.07 ± 0.04c |
0.90 ± 0.01c |
0.86 ± 0.01bc |
0.95 ± 0.02c |
1.00 ± 0.0 c |
1.06 ± 0.35 |
|
C15:0 |
0.94 ± 0.01bc |
0.70 ± 0.05a |
1.29 ± 0.01ef |
0.89 ± 0.01bc |
1.33 ± 0.10f |
1.16 ± 0.04e |
0.91 ± 0.00bc |
1.08 ± 0.00de |
0.91 ± 0.01bc |
0.93 ± 0.00bc |
0.98 ± 0.01bc |
1.01 ± 0.01cd |
1.01 ± 0.18 |
|
C16:0 |
18.50 ± 0.13d |
17.31 ± 0.64cd |
20.57 ± 0.50e |
15.86 ± 0.11bc |
20.49 ± 1.11e |
16.13 ± 0.38bc |
15.62 ± 0.28bc |
15.03 ± 0.29ab |
14.62 ± 0.06ab |
15.4 ± 0.27ab |
15.88 ± 0.25bc |
15.66 ± 0.02bc |
16.7 ± 2.02 |
|
C17:0 |
1.77 ± 0.02g |
1.83 ± 0.03g |
2.04 ± 0.03g |
1.52 ± 0.01f |
1.55 ± 0.02f |
1.43 ± 0.02e |
1.45 ± 0.03ef |
1.37 ± 0.01cde |
1.28 ± 0.01ab |
1.29 ± 0.03bcd |
1.39 ± 0.01de |
1.40 ± 0.00e |
1.53 ± 0.23 |
|
C18:0 |
9.64 ± 0.16e |
10.46 ± 0.15f |
9.24 ± 0.18e |
7.07 ± 0.01bc |
7.37 ± 0.13cd |
6.92 ± 0.11abc |
6.76 ± 0.23ab |
6.96 ± 0.07abc |
6.47 ± 0.08a |
6.81 ± 0.20abc |
7.14 ± 0.06bc |
7.73 ± 0.16d |
7.71 ± 1.29 |
|
C23:0 |
0.44 ± 0.04ab |
0.37 ± 0.01ab |
0.45 ± 0.01ab |
0.37 ± 0.15ab |
0.45 ± 0.00ab |
0.48 ± 0.02ab |
0.24 ± 0.22a |
0.53 ± 0.00ab |
0.44 ± 0.03ab |
0.44 ± 0.02ab |
0.58 ± 0.01b |
0.51 ± 0.08ab |
0.44 ± 0.10 |
|
SFA |
32.36 ± 0.33c |
31.27 ± 0.96c |
35.84 ± 0.80d |
26.54 ± 0.28ab |
33.66 ± 1.75cd |
27.19 ± 0.64ab |
25.97 ± 0.51ab |
26.03 ± 0.41ab |
24.62 ± 0.04a |
25.7 ± 0.51ab |
26.91 ± 0.36ab |
27.55 ± 0.50b |
28.6 ± 3.6 |
|
C15:1 |
0.30 ± 0.01ab |
1.23 ± 0.01e |
0.55 ± 0.01c |
0.25 ± 0.01ab |
0.39 ± 0.03bc |
0.31 ± 0.01ab |
0.14 ± 0.15a |
0.26 ± 0.00ab |
0.90 ± 0.05d |
0.24 ± 0.01ab |
0.36 ± 0.01b |
0.36 ± 0.01b |
0.44 ± 0.31 |
|
C16:1 |
6.05 ± 0.01cd |
4.16 ± 0.13a |
6.51 ± 0.01de |
6.53 ± 0.12de |
7.75 ± 0.31f |
6.98 ± 0.22e |
5.82 ± 0.03c |
5.56 ± 0.03bc |
5.70 ± 0.08bc |
5.22 ± 0.04 b |
6.38 ± 0.02d |
6.34 ± 0.05d |
6.08 ± 0.89 |
|
C17:1 |
0.30 ± 0.00a |
0.34 ± 0.00a |
0.25 ± 0.00a |
0.24 ± 0.01a |
0.20 ± 0.01a |
0.26 ± 0.02a |
0.26 ± 0.02a |
0.25 ± 0.01a |
0.88 ± 0.89a |
0.25 ± 0.02 a |
0.28 ± 0.01a |
0.29 ± 0.02a |
0.32 ± 0.26 |
|
C18:1 n9C |
16.60 ± 0.04def |
17.69 ± 0.08g |
18.84 ± 0.32h |
18.74 ± 0.12h |
21.02 ± 0.43i |
18.00 ± 0.16gh |
17.50 ± 0.19fg |
15.07 ± 0.14ab |
16.47 ± 0.02de |
16.2 ± 0.34cd |
17.34 ± 0.08efg |
15.30 ± 0.11bc |
17.4 ± 1.61 |
|
C20:1n9 |
0.98 ± 0.03abcd |
0.70 ± 0.07ab |
1.06 ± 0.04bcd |
0.54 ± 0.00a |
1.22 ± 0.13cd |
0.93 ± 0.05abcd |
0.68 ± 0.02ab |
1.01 ± 0.01abcd |
0.78 ± 0.00abc |
0.68 ± 0.31ab |
1.32 ± 0.06d |
1.07 ± 0.02bcd |
0.91 ± 0.25 |
|
C24:1n9 |
0.85 ± 0.01a |
0.65 ± 0.03a |
0.75 ± 0.01a |
0.63 ± 0.23a |
0.83 ± 0.03a |
0.92 ± 0.02a |
0.80 ± 0.01a |
0.89 ± 0.34a |
0.82 ± 0.01a |
0.87 ± 0.01 a |
0.90 ± 0.01a |
0.99 ± 0.02a |
0.83 ± 0.15 |
|
MUFA |
25.44 ± 0.08bcd |
24.75 ± 0.29abc |
28.50 ± 0.47e |
26.94 ± 0.01de |
31.75 ± 0.98f |
27.64 ± 0.52e |
25.25 ± 0.11bcd |
23.23 ± 0.27a |
25.56 ± 0.83cd |
23.5 ± 0.82ab |
26.96 ± 0.26de |
24.66 ± 0.10abc |
26.1 ± 2.35 |
|
C18:2 n6c |
2.48 ± 0.10ab |
3.63 ± 0.12h |
2.66 ± 0.05bcd |
3.23 ± 0.01g |
2.65 ± 0.10bc |
3.23 ± 0.03g |
3.08 ± 0.04fg |
2.87 ± 0.08def |
3.03 ± 0.06efg |
2.61 ± 0.03bc |
2.81 ± 0.01cde |
2.85 ± 0.02cdef |
2.93 ± 0.32 |
|
C18:3n3 |
0.51 ± 0.01bcd |
0.46 ± 0.01ab |
0.49 ± 0.02bc |
0.55 ± 0.01def |
0.52 ± 0.02cde |
0.52 ± 0.01cde |
0.60 ± 0.01f |
0.46 ± 0.00bc |
0.51 ± 0.01bcde |
0.50 ± 0.01bcd |
0.60 ± 0.01f |
0.56 ± 0.01ef |
0.52 ± 0.05 |
|
C20:2 |
1.23 ± 0.05d |
1.31 ± 0.01e |
0.98 ± 0.01ab |
0.94 ± 0.01a |
0.97 ± 0.01ab |
1.11 ± 0.00c |
1.00 ± 0.01ab |
1.21 ± 0.00d |
1.04 ± 0.01b |
1.20 ± 0.01 d |
1.49 ± 0.01f |
1.36 ± 0.02e |
1.15 ± 0.17 |
|
C20:4n6 |
7.77 ± 0.07ab |
9.28 ± 0.32c |
6.93 ± 0.14a |
8.11 ± 0.07b |
6.90 ± 0.53a |
8.55 ± 0.16bc |
8.60 ± 0.07bc |
9.18 ± 0.00c |
8.25 ± 0.05bc |
7.68 ± 0.06ab |
9.17 ± 0.15c |
8.16 ± 0.02b |
8.22 ± 0.80 |
|
C20:5n3 |
19.51 ± 0.42b |
20.25 ± 0.44bc |
15.89 ± 0.54a |
22.16 ± 0.04cde |
15.20 ± 1.18a |
21.17 ± 0.39bcd |
23.24 ± 0.50de |
23.84 ± 0.11e |
24.26 ± 0.37e |
24.5 ± 0.66 e |
20.90 ± 0.23bcd |
22.47 ± 0.08cde |
21.1 ± 2.98 |
|
C22:6n3 |
10.44 ± 0.10b |
9.05 ± 0.15a |
8.27 ± 0.19a |
11.26 ± 0.03bc |
8.02 ± 0.53a |
10.47 ± 0.23b |
11.82 ± 0.19cd |
13.08 ± 0.02ef |
12.74 ± 0.24de |
14.0 ± 0.32 f |
11.07 ± 0.05bc |
12.40 ± 0.18de |
11.1 ± 1.86 |
|
Σ PUFA |
42.20 ± 0.41b |
43.97 ± 1.25bc |
35.66 ± 1.27a |
46.51 ± 0.29bcdef |
34.59 ± 2.74a |
45.18 ± 1.16bcd |
48.78 ± 0.62def |
50.74 ± 0.14f |
49.83 ± 0.87ef |
50.7 ± 1.33 f |
46.13 ± 0.62bcde |
47.79 ± 0.39cdef |
45.1 ± 5.33 |
|
SFA |
32.36 ± 0.33c |
31.27 ± 0.96c |
35.84 ± 0.80d |
26.54 ± 0.28ab |
33.66 ± 1.75cd |
27.19 ± 0.64ab |
25.97 ± 0.51ab |
26.03 ± 0.41ab |
24.62 ± 0.04a |
25.7 ± 0.51ab |
26.91 ± 0.36ab |
27.55 ± 0.50b |
28.6 ± 3.61 |
|
UNSFA |
67.64 ± 0.33b |
68.73 ± 0.96b |
64.16 ± 0.80a |
73.46 ± 0.28cd |
66.34 ± 1.75ab |
72.81 ± 0.64cd |
74.03 ± 0.51cd |
73.97 ± 0.41cd |
75.38 ± 0.04d |
74.2 ± 0.51cd |
73.09 ± 0.36cd |
72.45 ± 0.50c |
2.54 ± 0.41 |
|
ω-3 |
30.45 ± 0.64b |
29.75 ± 0.73b |
24.65 ± 0.92a |
34.11 ± 0.21cd |
23.81 ± 2.01a |
32.29 ± 0.93bc |
35.73 ± 0.76cde |
37.38 ± 0.10de |
37.51 ± 0.76de |
39.1 ± 1.20 e |
32.65 ± 0.46bc |
35.43 ± 0.32cd |
32.7 ± 4.82 |
|
ω-6 |
10.36 ± 0.04ab |
12.91 ± 0.51e |
9.86 ± 0.12a |
11.34 ± 0.08bcd |
9.81 ± 0.73a |
11.78 ± 0.23cd |
11.83 ± 0.15cde |
12.14 ± 0.04de |
11.28 ± 0.12bcd |
10.3 ± 0.10ab |
11.99 ± 0.18cde |
11.00 ± 0.04bc |
11.2 ± 0.98 |
|
ω-9 |
18.79 ± 0.07bc |
19.03 ± 0.15bc |
21.18 ± 0.47d |
19.92 ± 0.11cd |
23.32 ± 0.54e |
20.09 ± 0.26cd |
19.01 ± 0.28bc |
17.15 ± 0.24a |
18.07 ± 0.03ab |
17.8 ± 0.79ab |
19.93 ± 0.21cd |
17.66 ± 0.13ab |
19.3 ± 1.70 |
|
ω-3/ ω-6 |
2.94 ± 0.05bc |
2.31 ± 0.04a |
2.50 ± 0.06a |
3.01 ± 0.04cd |
2.43 ± 0.02a |
2.74 ± 0.03b |
3.02 ± 0.10cd |
3.08 ± 0.00cd |
3.33 ± 0.03e |
3.80 ± 0.15 f |
2.72 ± 0.00b |
3.22 ± 0.02de |
2.92 ± 0.41 |
|
ω-6/ ω-3 |
0.34 ± 0.01de |
0.43 ± 0.01h |
0.40 ± 0.01g |
0.33 ± 0.00cd |
0.41 ± 0.00gh |
0.36 ± 0.00ef |
0.33 ± 0.01cd |
0.32 ± 0.00bcd |
0.30 ± 0.00b |
0.26 ± 0.01 a |
0.37 ± 0.00f |
0.31 ± 0.00bc |
0.35 ± 0.05 |
|
DHA/ EPA |
0.54 ± 0.01efg |
0.45 ± 0.00a |
0.52 ± 0.01cde |
0.51 ± 0.00bc |
0.53 ± 0.01de |
0.49 ± 0.00b |
0.51 ± 0.00bcd |
0.55 ± 0.00fg |
0.53 ± 0.00cde |
0.57 ± 0.00 h |
0.53 ± 0.00ef |
0.55 ± 0.01g |
0.52 ± 0.03 |
|
UNSFA /SFA |
2.09 ± 0.03ab |
2.20 ± 0.10b |
1.79 ± 0.06a |
2.77 ± 0.04cd |
1.97 ± 0.16ab |
2.68 ± 0.09c |
2.85 ± 0.08cd |
2.84 ± 0.06cd |
3.06 ± 0.01d |
2.89 ± 0.08cd |
2.72 ± 0.05c |
2.63 ± 0.07c |
2.54 ± 0.41 |
|
AI |
0.34 ± 0.01b |
0.29 ± 0.02ab |
0.43 ± 0.02c |
0.26 ± 0.00a |
0.43 ± 0.04c |
0.28 ± 0.01ab |
0.26 ± 0.01a |
0.27 ± 0.01a |
0.25 ± 0.00a |
0.26 ± 0.00 a |
0.27 ± 0.01a |
0.28 ± 0.004a |
0.30 ± 0.06 |
|
FLQ |
24.33 ± 0.51c |
24.11 ± 0.60c |
16.97 ± 0.63b |
29.45 ± 0.01d |
13.87 ± 1.25a |
22.30 ± 0.53c |
24.21 ± 0.59c |
30.95 ± 0.09de |
34.71 ± 0.71f |
33.0 ± 1.02ef |
22.23 ± 0.24c |
29.88 ± 0.27d |
25.5 ± 6.20 |
|
h/H |
2.93 ± 0.05b |
3.37 ± 0.20bc |
2.41 ± 0.09a |
3.85 ± 0.02cde |
2.45 ± 0.25a |
3.61 ± 0.15cd |
3.95 ± 0.09de |
4.01 ± 0.08de |
4.20 ± 0.04e |
4.03 ± 0.11de |
3.68 ± 0.09cd |
3.71 ± 0.04cd |
3.52 ± 0.60 |
|
TI |
0.26 ± 0.01b |
0.26 ± 0.01b |
0.33 ± 0.02c |
0.19 ± 0.00a |
0.32 ± 0.04c |
0.20 ± 0.01a |
0.18 ± 0.07a |
0.17 ± 0.00a |
0.16 ± 0.00a |
0.17 ± 0.01 a |
0.20 ± 0.01a |
0.19 ± 0.00a |
0.22 ± 0.06 |
|
PI |
1.62 ± 0.05b |
1.69 ± 0.11bc |
1.18 ± 0.07a |
2.11 ± 0.02d |
1.14 ± 0.16a |
1.96 ± 0.09cd |
2.25 ± 0.09de |
2.46 ± 0.05e |
2.53 ± 0.04e |
2.50 ± 0.12 e |
2.01 ± 0.05cd |
2.23 ± 0.02de |
1.97 ± 0.47 |
Different lowercase letters in the same row indicate significant differences between months (P<0.05).
It has been reported that monounsaturated fatty acids (MUFA) of various crab species were between 23.18-30.9%, and, similar to this study, the dominant fatty acids were Oleic acid (C18:1n9C) and Palmitoleic acid (C16:1) (Ayas and Özoğul, 2011a; Barrento et al., 2010; Cherif et al., 2008). The total amount of MUFA was determined to be the lowest during the breeding season (August-October: 23.23 ± 0.27-23.50 ± 0.82%) and the highest at the beginning of the breeding season when feeding is intense (May: 31.75 ± 0.98%). The differences between months were statistically significant (p<0.05).
The importance of polyunsaturated fatty acids (PUFA) in both human and animal diets continues to increase. Several studies have shown the relation between the consumption of ω-3 fatty acids, such as Eicosapentaenoic acid (EPA, C20: 5n3) and Docosahexaenoic acid (DHA, C22: 6n3), and the decrease in the risks of coronary heart disease (Harper and Jacobson, 2005) and cancer (Roynette et al., 2004) In line with this study, it has been reported that the highest fatty acids among PUFAs are EPA, DHA, and ARA (Arachidonic acids) in different crabs (Ayas and Özoğul, 2011a; Barrento et al., 2010; Cherif et al., 2008). These studies have reported that PUFAs were between 36.12-52.18%, whereas EPA, DHA, and ARA fatty acids varied between 8.9-24.1, 10-14.57, 5.64-11.8%, respectively. As shown in Table V, PUFAs were observed to be the lowest in May (34.59 ± 2.735%) and the highest in August and October (50.74 ± 0.140 and 50.76 ± 1.326%, respectively). The differences between these months were statistically significant (p<0.05). The lowest EPA, DHA, and ARA were observed in May (15.20 ± 1.18, %8.02 ± 0.53, and 6.90 ± 0.53%, respectively), the highest EPA and DHA were determined in October (24.54 ± 0.66 and 14.06 ± 0.32%, respectively), and the highest ARA was in February (9.28 ± 0.32). It was observed that the differences between these months were statistically significant (p<0.05). The values observed in this study are within the range specified in the literature.
For maintaining good health, it is recommended to meet the requirement of both ω-3 and ω-6 fatty acids. In addition, to reduce the risk of obesity and cardiovascular diseases, the ω-6 intake should not exceed the required amount, whereas ω-3 consumption ought to be increased (Simopoulos, 2002). The highest ω-3 fatty acid was observed in October (39.10 ± 0.1.20) and the highest ω-6 was observed in February (12.91 ± 0.51). On the other hand, the lowest ω-3 and ω-6 values were observed in May (23.81 ± 2.01 and 9.81 ± 0.73%, respectively) (Table V). The differences between months were found to be statistically significant (p<0.05). During the early ages of humanity, the ratio of ω-6:ω-3 was 1:1. With industrialization and subsequent change in diet, this ratio increased to 30:1-50:1. The World Health Organization reported that ω-6:ω-3 ratio should be between 5:1 and 10:1 (FAO/WHO, 1994). However, for healthy nourishment, this ratio should range between 1:1 and 1:4 (Simopoulos et al., 2000). The ω-6:ω-3 ratio (1:2.92) in our study indicates that the warty crab captured from the Black Sea is extremely healthy food and can be included in the diet for balanced nourishment.
It has been reported that atherogenic (AI) and thrombogenic indexes (TI) higher than 1.0 may be harmful to humans (Ouraji et al., 2009). The decrease in this value reduces the risk of coronary heart disease (Cutrignelli et al., 2008). In the present study, the lowest AI was observed in September (0.25 ± 0.00) and the highest was determined in March and May (0.43). Maulvault et al. (2012) reported that AI was 0.26 during spring and 0.21 during summer for C. pagurus. Varisco et al. (2020) calculated AI as 0.25 and TI as 0.56 for the squat lobster (M. gregaria). In the study conducted by Simat et al. (2015), the AI and TI values were 0.92 and 0.33 for wild bogue (Boops boops), while they were 0.59 and 0.29 for farmed bogue, respectively. Çağlak and Karslı (2017) reported the AI values for zander (Sander lucioperca) during winter, spring, summer, autumn as 0.41, 0.38, 0.49, 0.45, and TI values as 0.22, 0.31, 0.28, 0.25, respectively. The AI value obtained in this research was similar to the values reported in the studies of Varisco et al. (2020), Maulvault et al. (2012), Çağlak and Karslı (2017), whereas, it was evaluated as healthier than that of Simat et al. (2015). The TI value in this study was determined to be the highest in May (0.32) and the lowest in September (0.16). These results show that E. verrucosa meat consists of healthy and quality fatty amino acids, similar to other aquatic products. Furthermore, Valfre (2008) reported the AI [beef (0.5-0.86), pork (0.44-0.86), chicken (0.43), rabbit (1.11)] and TI indexes [beef (0.69-1.67), pork (0.97-1.67), chicken (1.39), rabbit (2.06)] of certain meat products consumed in Italy. According to these results, the warty crab is considered to be extremely healthy compared to other meat products in terms of both AI and TI indexes and may reduce the risk of heart diseases when consumed.
Abrami et al. (1992) reported that as the fish lipid quality (FLQ) index increases, the nutritional quality also increases. In this study, the lowest FLQ was determined in May (13.87 ± 1.25) and the highest was determined in September (34.71 ± 0.71). The fatty acid composition in E. verrucosa meat was found to be much higher in quality, especially during August, September, and October in comparison with the other months.
According to Sousa Bentes et al. (2009), the h/H ratio of fatty acids indicates whether the fat in the food is sufficient or not. In this study, the lowest h/H ratio was observed in May (2.45 ± 0.25) and the highest was in September (4.20 ± 0.04). Varisco et al. (2020) reported the h/H ratio for squat lobster (M. gregaria) as 4.07, while this ratio for zander (Sander lucioperca) was 2.77, 2.17, 2.35, and 2.70 during spring, summer, autumn, and winter, respectively (Çağlak and Karslı, 2017). According to these data, it can be said that the nutritional fat quality of warty crab is similar to that of squat lobster and higher than that of zander.
The decrease in the PI index is an indication of the deterioration in the quality of PUFAs (Simat et al., 2015). The PI index was reported as 1.11 for wild bogue (Boops boops) and 1.01 for farmed bogue (Simat et al., 2015). García-Soto et al. (2017) calculated the PI value for Munidia spp. (crustacea) as 2.51 during winter and 3.09 during summer. Varisco et al. (2020) reported this value as 2.58 for squat lobster (M. gregaria). In this study, the lowest PI ratio was observed in May (1.18 ± 0.07) and the highest was observed in September (2.53 ± 0.04). According to these results, it can be said that the PI index of E. verrucosa is similar to those of Munidia spp. and squat lobster, and its PUFA quality is much higher than the bogue.
CONCLUSIONS
In conclusion, the warty crab caught from the southern coast of the Black Sea is a product containing low fat and high protein levels. It has an amino acid composition that, even when consumed one meal a day, could meet most of the daily requirement specified by the World Health Organization. Moreover, the ratios of ω-3/ω-6 fatty acids and PI, AI, TI, h/H, and FLQ values are at a recommendable level for a healthy diet and to reduce the risk of heart diseases. In the present study, it was shown that the warty crab is as nutritious as blue crab or other crustacea consumed globally.
Funding
The present study was supported by Scientific Research Projects Commission (BAP) of Sinop University under the project number: MYO-1901-14-01.
Data availability
Data are available upon reasonable request to the author with approval of the funding organization.
Ethics statement
All procedures followed in this study have been approved by the Ethical Commission of Sinop University with the Ethical Commission Approval Number: Sinop Uni-HADYEK 2014/26.
Statement of conflict of interest
The author have declared no conflict of interest.
REFERENCES
Abe, H. and Ohmama, S., 1987. Effect of starvation and sea-water acclimation on the concentration of free l-histidine and related dipeptides in the muscle of eel, rainbow trout and Japanese dace. Comp. Biochem. Physiol. Part B Comp. Biochem., 88: 507–511. https://doi.org/10.1016/0305-0491(87)90335-X
Abrami, G., Natiello, F., Bronzi, P., McKenzie, D., Bolis, L. and Agradi, E., 1992. A comparison of highly unsaturated fatty acid levels in wild and farmed eels (Anguilla anguilla). Comp. Biochem. Physiol. Part B Comp. Biochem., 101: 79–81. https://doi.org/10.1016/0305-0491(92)90161-J
AOAC (Association of Official Analytical Chemists), 1995. Official Methods of Analysis of AOAC International. 2 vols. 16th edition. Association of Analytical Chemists, Arlington, VA, USA.
AOAC (Association of Official Analytical Chemists), 2005. Official Methods of Analysis of Association of Official Analytical Chemists, 18th ed. Gaithersburg, MD: AOAC.
Arrieta, M.P. and Prats-Moya, M.S., 2012. Free amino acids and biogenic amines in Alicante Monastrell wines. Fd. Chem., 135: 1511–1519. https://doi.org/10.1016/j.foodchem.2012.06.008
Ayas, D. and Özoğul, Y., 2011a. The chemical composıtıon of sexually mature blue swimmer crab (Portunus pelagicus, Linnaeus 1758) ın the mersin bay. J. Fish., 5: 308–316. https://doi.org/10.3153/jfscom.2011035
Ayas, D. and Özoğul, Y., 2011b. The chemical composition of carapace meat of sexually mature blue crab (Callinectes sapidus, Rathbun 1896) in the Mersin Bay. J. Fish., 5: 262–269. https://doi.org/10.3153/jfscom.2011030
Aydin, M., Karadurmuş, U. and Mutlu, C., 2013. Orta ve Doğu Karadeniz’deki (Türkiye) Yengeç Türleri. Black Sea J. Sci., 3: 1–16.
Barrento, S., Marques, A., Teixeira, B., Mendes, R., Bandarra, N., Vaz-Pires, P. and Nunes, M.L., 2010. Chemical composition, cholesterol, fatty acid and amino acid in two populations of brown crab Cancer pagurus: Ecological and human health implications. J. Fd. Compos. Anal., 23: 716–725. https://doi.org/10.1016/j.jfca.2010.03.019
Bayrakli, B., 2020. Concentration and potential health risks of trace metals in warty crab (Eriphia verrucosa Forskal, 1775) from Southern Coasts of the Black Sea, Turkey. Environ. Sci. Pollut. Res., 28: 14739–14749. https://doi.org/10.1007/s11356-020-11563-9
Bentes, Á.D.S., De Souza, H.A.L., Simões, M.G. and Mendonça, X.M.F.D., 2009. Physical and chemical characterization and lipid profile of three amazon fish species. Rev. Bras. Tecnol. Agroind., 3: 97–108.
Çaǧlak, E. and Karsli, B., 2017. Seasonal variation of fatty acid and amino acid compositions in the muscle tissue of zander (Sander lucioperca linnaeus, 1758) and the evaluation of important indexes related to human health. Ital. J. Fd. Sci., 29: 266–275.
Chen, D.-W., Zhang, M. and Shrestha, S., 2007. Compositional characteristics and nutritional quality of Chinese mitten crab (Eriocheir sinensis). Fd. Chem., 103: 1343–1349. https://doi.org/10.1016/j.foodchem.2006.10.047
Cherif, S., Frikha, F., Gargouri, Y. and Miled, N., 2008. Fatty acid composition of green crab (Carcinus mediterraneus) from the Tunisian mediterranean coasts. Fd. Chem., 111: 930–933. https://doi.org/10.1016/j.foodchem.2008.05.007
Chi, Z., Yan, K., Gao, L., Li, J., Wang, X. and Wang, L., 2008. Diversity of marine yeasts with high protein content and evaluation of their nutritive compositions. J. Mar. Biol. Assoc. U. K., 88: 1347–1352. https://doi.org/10.1017/S0025315408001938
Cutrignelli, M.I., Calabrò, S., Bovera, F., Tudisco, R., D’Urso, S., Marchiello, M., Piccolo, V. and Infascelli, F., 2008. Effects of two protein sources and energy level of diet on the performance of young Marchigiana bulls. 2. Meat quality. Ital. J. Anim. Sci., 7: 271–285. https://doi.org/10.4081/ijas.2008.271
Durmus, M., Ayas, D., Aydin, M., Kosker, A.R., Ucar, Y. and Ozogul, Y., 2018. The effects of sex and seasonality on the metal levels of warty crab (Eriphia verrucosa) in the Black Sea. J. Aquat. Fd. Prod. Technol., 27: 749–758. https://doi.org/10.1080/10498850.2018.1485196
Duyar, H.A. and Eke, E., 2009. Production and quality determination of marinade from different fish species. J. Anim. Vet. Adv., 8: 270-275.
Erickson, M.C., 1993. Lipid extraction from channel catfish muscle: Comparison of solvent systems. J. Fd. Sci., 58: 84–89. https://doi.org/10.1111/j.1365-2621.1993.tb03217.x
Erkan, M., Balkıs, H., Kurun, A. and Tunalı, Y., 2008. Seasonal variations in the ovary and testis of Eriphia verrucosa (Forskål, 1775) (Crustacea: Decapoda) from Karaburun, SW Black Sea. Pakistan J. Zool., 40: 217–221.
FAO/WHO (Food and Agriculture Organization of the United Nations/ World Health Organization), 1994. Fats and oils in human nutrition. Report of a joint expert consultation. Food and Agriculture Organization of the United Nations, Rome, Italy.
FAO/WHO/UNU (Food and Agriculture Organization of the United Nations/ World Health Organization), 1985. Energy and protein requirements. Report of a Joint FAO/WHO/UNU expert consultation. WHO, Geneva, Switzerland.
FAO/WHO (Food and Agriculture Organization of the United Nations/ World Health Organization), 2013. Dietary Protein Quality Evaluation in Human Nutrition. FAO Food and Nutrition Paper, 92. ISSN 0254– 4725, FAO, Rome. Retrieved from http://www.fao.org/3/a-i3124e. pdf
FAO (Food and Agriculture Organization of the United Nations), 2020. The state of world fisheries and aquaculture. Retrieved from http://www.fao.org/3/ca9229en/ca9229en.pdf
Fernández, M., Ordóñez, J.A., Cambero, I., Santos, C., Pin, C. and Hoz, L. de la, 2007. Fatty acid compositions of selected varieties of Spanish dry ham related to their nutritional implications. Fd. Chem., 101: 107–112. https://doi.org/10.1016/j.foodchem.2006.01.006
García-Soto, B., Trigo, M., Barros-Velázquez, J. and Aubourg, S.P., 2017. A comparative study of lipid composition of an undervalued crustacean ( Munida spp.) captured in winter and summer. J. Aquat. Fd. Prod. Technol., 26: 1004–1013. https://doi.org/10.1080/10498850.2017.1375058
Hammer, Ø., Harper, D.A.T. and Ryan, P.D., 2001. Past: Paleontological statistics software package for education and data analysis. Palaeontol. Electron., 4: 9.
Harper, C.R. and Jacobson, T.A., 2005. Usefulness of Omega-3 fatty acids and the prevention of coronary heart disease. Am. J. Cardiol., 96: 1521–1529. https://doi.org/10.1016/j.amjcard.2005.07.071
Küçükgülmez, A. and Çelik, M., 2008. Amino acid composition of blue crab (Callinectes sapidus) from the North Eastern Mediterranean Sea. J. appl. Biol. Sci., 2: 39–42.
Le Couteur, D.G., Solon-Biet, S.M., Cogger, V.C., Ribeiro, R., de Cabo, R., Raubenheimer, D., Cooney, G.J. and Simpson, S.J., 2020. Branched chain amino acids, aging and age-related health. Ageing Res. Rev., 64: 101198. https://doi.org/10.1016/j.arr.2020.101198
Lubis, Z. and Buckle, K.A., 2007. Rancidity and lipid oxidation of dried-salted sardines. Int. J. Fd. Sci. Technol., 25: 295–303. https://doi.org/10.1111/j.1365-2621.1990.tb01085.x
Marques, A., Teixeira, B., Barrento, S., Anacleto, P., Carvalho, M.L. and Nunes, M.L., 2010. Chemical composition of Atlantic spider crab Maja brachydactyla: Human health implications. J. Fd. Compos. Anal., 23: 230–237. https://doi.org/10.1016/j.jfca.2009.10.007
Maulvault, A.L., Anacleto, P., Loureno, H.M., Carvalho, M.L., Nunes, M.L. and Marques, A., 2012. Nutritional quality and safety of cooked edible crab (Cancer pagurus). Fd. Chem., 133: 277–283. https://doi.org/10.1016/j.foodchem.2012.01.023
Millward, D.J., 2012. Identifying recommended dietary allowances for protein and amino acids: A critique of the 2007 WHO/FAO/UNU report. Br. J. Nutr., pp. 108. https://doi.org/10.1017/S0007114512002450
Naczk, M., Williams, J., Brennan, K., Liyanapathirana, C. and Shahidi, F., 2004. Compositional characteristics of green crab (Carcinus maenas). Fd. Chem., 88: 429–434. https://doi.org/10.1016/j.foodchem.2004.01.056
Naji, A., Khan, F.R. and Hashemi, S.H., 2016. Potential human health risk assessment of trace metals via the consumption of marine fish in Persian Gulf. Mar. Pollut. Bull., 109: 667–671. https://doi.org/10.1016/j.marpolbul.2016.05.002
Ouraji, H., Shabanpour, B., Kenari, A.A., Shabani, A., Nezami, S., Sudagar, M. and Faghani, S., 2009. Total lipid, fatty acid composition and lipid oxidation of Indian white shrimp (Fenneropenaeus indicus) fed diets containing different lipid sources. J. Sci. Fd. Agric., 89: 993–997. https://doi.org/10.1002/jsfa.3545
Özdemir, S., Özsandıkçı, U., Erdem, Y. and Büyükdeveci, F., 2017. Catch composition of crab species that as bycatch captured by trammel nets used on Sinop coasts. Turk. J. Marit. Mar. Sci., 3: 55–62.
Oztekin, A., Yigit, M., Kizilkaya, B., Ucyol, N., Tan, E., Yilmaz, S., Bulut, M., Ayaz, A. and Ergun, S., 2020. Nutritional quality of amino acid in farmed, farm-aggregated and wild Axillary seabream (Pagellus acarne) with implications to human health. Aquac. Res., 51: 1844–1853. https://doi.org/10.1111/are.14534
Roynette, C.E., Calder, P.C., Dupertuis, Y.M. and Pichard, C., 2004. n-3 Polyunsaturated fatty acids and colon cancer prevention. Clin. Nutr., 23: 139–151. https://doi.org/10.1016/j.clnu.2003.07.005
Šimat, V., Bogdanović, T., Poljak, V. and Petričević, S., 2015. Changes in fatty acid composition, atherogenic and thrombogenic health lipid indices and lipid stability of bogue (Boops boops Linnaeus, 1758) during storage on ice: Effect of fish farming activities. J. Fd. Compos. Anal., 40: 120–125. https://doi.org/10.1016/j.jfca.2014.12.026
Simopoulos, A., 2002. The importance of the ratio of omega-6/omega-3 essential fatty acids. Biomed. Pharmacother., 56: 365–379. https://doi.org/10.1016/S0753-3322(02)00253-6
Simopoulos, A.P., Leaf, A. and Salem, N., 2000. Workshop statement on the essentiality of and recommended dietary intakes for omega-6 and omega-3 fatty acids. Prostaglandins Leukot. Essent. Fat. Acids, 63: 119–121. https://doi.org/10.1054/plef.2000.0176
Smoothey, A.F., 2013. Habitat-associations of turban snails on ıntertidal and subtidal rocky reefs. PLoS One, 8: e61257. https://doi.org/10.1371/journal.pone.0061257
Soundarapandian, P., Varadharajan, D., Sivasubramanian, C. and Irin Kumari, A., 2014. Amino Acid profiles of ridged swimming crab, Charybdis natator Herbst. J. Aquac. Res. Dev., 5: 5. https://doi.org/10.4172/2155-9546.1000287
Tacon, A.G.J., 2002. Thematic review of feeds and feed management practices in shrimp aquaculture, report prepared under the world bank, NACA, WWF and FAO consortium program on shrimp farming and the environment. Work in Progress for Public Discussion. Published by the Consortium.
Teymoori, F., Asghari, G., Mirmiran, P. and Azizi, F., 2018. High dietary intake of aromatic amino acids increases risk of hypertension. J. Am. Soc. Hypertens, 12: 25–33. https://doi.org/10.1016/j.jash.2017.11.004
Tureli, C., Erdem, Ü. and Çelik, M., 2002. Seasonal variation and meat composition of blue crab (Callinectes sapidus, Rathbun, 1896) caught in İskenderun Bay, North-East Mediterranean. Turk. J. Vet. Anim. Sci., 26: 1435–1439.
TurkStat, 2020. Turkish Fishery Statistics 2019. Turkish Statistical Institute. Retrieved on February 16, 2021 from https://biruni.tuik.gov.tr/medas/?kn=97andlocale=tr
Ulbricht, T.L.V. and Southgate, D.A.T., 1991. Coronary heart disease: Seven dietary factors. Lancet, 338: 985–992. https://doi.org/10.1016/0140-6736(91)91846-M
Valfrè, F., 2008. The control of risk in animal husbandry primary production. Vet. Res. Commun., 32: 3–9. https://doi.org/10.1007/s11259-008-9082-6
Varisco, M., Crovetto, C., Colombo, J., Vinuesa, J. and Risso, S., 2020. Proximate composition and nutritional quality of the meat of the squat lobster Munida gregaria (Fabricius 1973). J. Aquat. Fd. Prod. Technol., 29: 229–237. https://doi.org/10.1080/10498850.2020.1719256
Wilson, J., 2002. Scientific uncertainty, complexe systems and the design of common-pool ınstitutions. In: The drama of the commons (eds. E. Ostrom, T., Dietz, N., Dolsak, P.C., Stern, S.U., Stonich and E. Weber). pp. 533.
Wu, G., 2013. Functional amino acids in nutrition and health. Amino Acids, 45: 407–411. https://doi.org/10.1007/s00726-013-1500-6
Wu, Zhou, B., Cheng, Y., Zeng, C., Wang, C. and Feng, L., 2010. Comparison of gender differences in biochemical composition and nutritional value of various edible parts of the blue swimmer crab. J. Fd. Compos. Anal., 23: 154–159. https://doi.org/10.1016/j.jfca.2009.08.007
To share on other social networks, click on any share button. What are these?


