Mathematical Modeling and Optimization of Physical Properties of Paddy as Influenced by Drying


Research Article
Mathematical Modeling and Optimization of Physical Properties of Paddy as Influenced by Drying
Shakeel Ahmed Soomro1,2, Sikandar Almani3, Lal Bux4, Khalil Ahmed Ibupoto2, Muhammad Sohail Memon2, Farman Ali Chandio2, Shakeel Hussain Chattha2, Zaheer Ahmed Khan2, Zubair Ahmed Soomro5, Babar Mustafa Ansari6 and Kunjie Chen1*
1College of Engineering, Nanjing Agricultural University, Nanjing 210031, China; 2Faculty of Agricultural Engineering, Sindh Agriculture University, Tandojam 70060, Pakistan; 3Department of Chemical Engineering, Mehran University of Engineering and Technology, Jamshoro 76020, Pakistan; 4Shaheed Benazir Bhutto University, Shaheed Benazirabad 67450, Pakistan; 5Faculty of Animal Husbandry and Veterinary Sciences, Sindh Agriculture University, Tandojam 70060, Pakistan; 6Khairpur College of Agricultural Engineering and Technology, Khairpur, Pakistan.
Abstract | Present study was conducted to assess the effect of drying on physical properties of Nanjing 9108 paddy variety using response surface methodology. A mathematical model was used predicting the effects of indicators i.e. temperature (40.86, 45, 55, 65 and 69.14 ºC) and time (4.11, 30, 92.5, 155 and 180 min) each with five levels on observed parameters. The suitability of quadratic model for present study was described by the responses having acceptable R2 and Adj. R2 values, non-significance of lack of fit which compares residual to pure error and significance of analysis of variance which is essential for testing the applicability of the model. Predicted optimum temperature and time were 63 ºC and 142.5 min respectively and predicted length, width, thickness, TKW, bulk density, true density, porosity and hardness under these conditions were 6.72mm, 3.32mm, 2.27mm, 27.38 g, 716.78 kg m-3, 1459.14 kg m-3, 51.24% and 45.26 N respectively. The results further revealed that the effect of temperature and time on paddy decreased with process except porosity and hardness, which increased as affected by these conditions. The results showed that the model work was valid for predicting the responses being affected by the indicators, and optimizing the physical properties of paddy. Central composite design of response surface methodology was successfully used studying the dependence of physical properties of paddy. The valuable results of this study can be utilised by the rice processing industries.
Received | March 29, 2020; Accepted | December 08, 2020; Published | May 04, 2021
*Correspondence | Kunjie Chen, College of Engineering, Nanjing Agricultural University, Nanjing 210031, China; Email: kunjiechen@njau.edu.cn
Citation | Soomro, S.A., S. Almani, L. Bux, K.A. Ibupoto, M.S. Memon, F.A. Chandio, S.H. Chattha, Z.A. Khan, Z.A. Soomro, B.M. Ansari and K. Chen. 2020. Mathematical modeling and optimization of physical properties of paddy as influenced by drying. Pakistan Journal of Agricultural Research, 34(2): 337-345.
DOI | https://dx.doi.org/10.17582/journal.pjar/2021/34.2.337.345
Keywords | Mathematical modeling, Optimization, RSM, Physical properties, Paddy, Nanjing 9108
Introduction
Rice in production and for food purpose contributes second leading crop after wheat annually. 114 countries, mostly developing cultivates rice which is also a primary source of income employing more than 100 million households in the regions of Asia and Africa (Zareiforoush et al., 2011). Across to half of World’s population, rice is being provided as a staple food. Milled rice about 480 million metric tons is being produced annually where 50% of rice is being grown and consumed by China and India only (Muthayya et al., 2014). Whatever the processed products are i.e. parboiled, puffed, whole and flaked etc. rice has a sole position in food applications (Juliano, 1985). Physical properties of rice are mandatory to be investigated for post-harvest processing and their qualities (Soomro et al., 2018). While designing appropriate machines related to processing operations, the knowledge of physical and engineering properties is necessarily useful (Sahay and Singh, 1994; Correa et al., 2007; Liu et al., 2009). Moisture dependent physical and engineering properties are important to be measured during the design of planting, harvesting, handling operations, transporting and processing machineries (Olajide et al., 2000; Coskuner and Karababa, 2007). Storage structures and grain holding bins calculation also requires such kind of informative knowledge (Thompson and Ross, 1983). Rice physical and mechanical properties are of importance while design and selection of storage structure and their processing equipment’s, which do depends on grain moisture content, therefore consideration of certain properties has a significant role to play (Mohsenin, 1986; Molenda et al., 2002; Kashaninejad et al., 2006). Physical characteristics of rice i.e. grain thickness have an effect on the volume expansion of cooked rice, followed by degree of milling and apparently amylose content (Mohapatra and Bal, 2007; Yousaf et al., 2018). Paddy’s size, shape and structural characteristics are important while designing storage bins, silos and separation of desirable materials (Zareiforoush et al., 2011).
Researchers are using Response Surface Method (RSM), which is considered as an excellent method for optimizing the various factors. It’s a combination of mathematical and statistical methods that decide the optimum conditions by reducing the number of experiments (Ghosh and Hallenbeck, 2010). These techniques of RSM are useful in developing, enhancing and optimisation of processes (Montgomery, 2005). Several studies have been carried out using RSM for optimizing different factors, but a gap still occurs when subjected to optimisation of the physical properties of paddy as influenced by drying. The study was therefore conducted to investigate the optimum conditions being affected by process indicators (temperature and time) and prediction of variables by mathematical modeling.
Materials and Methods
Sample preparation
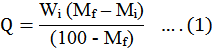
The present research was carried out at Nanjing Agricultural University. Paddy variety Nanjing 9108 was cleaned properly removing all foreign, broken and immature grains before the experiment. Initial moisture content of paddy was determined by oven drying method, keeping samples at 103 ºC for 48 hours (Sacilik et al., 2003). Amounted distilled water was added to paddy (Equation 1), to meet the required moisture content (Coşkun et al., 2006; Kumar et al., 2016). Paddy samples were then sealed properly using polyethylene bags and were kept in the refrigerator for 7 days at 4 ºC to let the moisture be uniformly distributed (Suthar and Das, 1996; Zareiforoush et al., 2011). Selected paddy samples accordingly were then dried as per design arranged by CCD (Table 1) using a laboratory dryer.
Experimental design
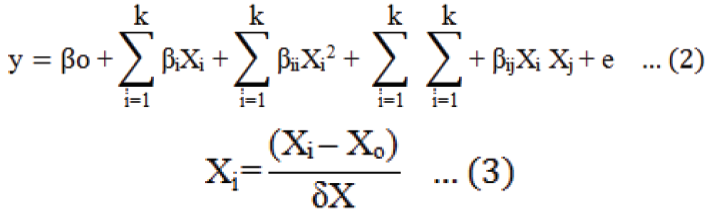
Responses in the current study being affected by temperature and time were examined by employing RSM with central composite design (CCD). The design including thirteen experiments was adopted with five replications of the center point. The responses can then be associated with these factors through a linear or quadratic model, thus enabling optimization. A quadratic model with a linear model also included is shown in Equation 2 given below (Khuri and Cornell, 1996; Yousaf et al., 2017). Run and experimental conditions for eight experiments with a combination of five replications arranged by central composite design are presented in Table 1, where Equation 3 was used for calculating the coded values.
Determination of parameters
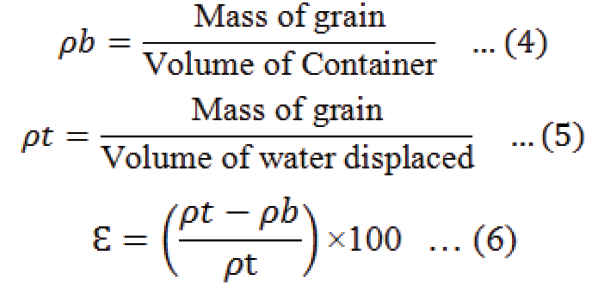
Hundred grains were randomly selected for determining their axial dimensions i.e. length (L), width (W) and thickness (T) using a digital Vernier calliper with an accuracy of 0.01mm (Mohsenin, 1986; Shittu et al., 2012; Jamali et al., 2016). For thousand kernel weight hundred grains were randomly selected and weighed using electronic weight balance with an accuracy of 0.0001g, weight of the hundred grains was then multiplied by ten to have TKW (Kingsly et al., 2006; Tavakoli et al., 2009; Gharibzahedi et al., 2010). For determining the bulk density (ρb), the grains were filled in a volume known container and weighed using an electronic weight balance. Bulk density was calculated by taking ratio of mass of sample to the total volume (Olajide et al., 2000; Konak et al., 2002; Kumar et al., 2016). Water displacement method was used for the determination of true density (ρt). It was calculated by dividing mass of the sample to its grain volume (Olajide et al., 2000; Demir et al., 2002; Kumar et al., 2016). Porosity (Ɛ) as described by Mohsenin (1986); Jain and Bal (1997) was calculated using Equation 6. TMS-Pro machine (FTC Co. USA) was used for measuring the hardness of paddy. The load through stainless steel probe with a measuring accuracy of five percent was applied to grain samples which were placed horizontally on base. Average values of hardness for ten grains were then reported accordingly for each sample.
Statistical analysis
Statistical software Design Expert (Ver. 8.0.6) was used for executing central composite design. Analysis of variance and multiple regressions were executed to test the lack of fit and significance (p≤0.05) of interactions of independent variable and responses. The adequacy of model was checked by considering the values of R2, Adj. R2 and lack of fit.
Results and Discussion
Model description and accuracy
Two independent factors temperature and time were chosen as variables observing their effects on responses length, width, thickness, TKW, bulk density, true density, porosity and hardness. Actual responses with predicted values for each run are presented in Table 2. ANOVA is essential for testing applicability of the model which was found to be significant. The lack of fit which compares residual to pure error was non-significant, showing that the model applied was valid. The quadratic model suitably described the responses, having acceptable R2 values. Regression equations, correlation coefficient (R2), adjusted R2 and values for lack of fit with coded form are presented in Table 3.
Table 1: Independent variables factor design arranged by CCD.
|
Run |
Coded form |
Actual form |
||
|
X1 |
X2 |
X1 (OC) |
X2 (min) |
|
|
1 |
-1 |
-1 |
45 |
30 |
|
2 |
1 |
-1 |
65 |
30 |
|
3 |
-1 |
1 |
45 |
155 |
|
4 |
1 |
1 |
65 |
155 |
|
5 |
-1.41 |
0 |
40.86 |
92.5 |
|
6 |
1.41 |
0 |
69.14 |
92.5 |
|
7 |
0.00 |
-1.41 |
55 |
4.11 |
|
8 |
0 |
1.41 |
55 |
180 |
|
9 |
0 |
0 |
55 |
92.5 |
|
10 |
0 |
0 |
55 |
92.5 |
|
11 |
0 |
0 |
55 |
92.5 |
|
12 |
0 |
0 |
55 |
92.5 |
|
13 |
0 |
0 |
55 |
92.5 |
Note: X1: Temperature, X2: Time.
Axial dimensions
Axial dimensions i.e. length, width and thickness as shown in Table 3 were significantly affected by temperature and time. Relationship between indicators and axial dimensions are shown in (Figure 1a-c). A decrease was observed for axial dimensions with an increase in both temperature and time. The maximum and minimum values for length were 7 and 6.68 mm at run 7 and 4, for width they were 3.57 and 3.3 mm at run 2 and 4, while for thickness they were 2.52 and 2.25 mm at run 7 and 4 respectively. Optimized temperature and time analyzed by the software was 63ºC and 142.5 min having predicted values of 6.72, 3.32 and 2.27 mm for length, width and thickness. R2 the goodness fit which ranges between 0-1 should be more ten 80% for a well fitted regression model (Aghaie et al., 2009), the R2 for length, width and thickness were analyzed to be 0.99, 0.97 and 0.98. The significance of the model was further cross checked by F-test, the ANOVA indicated that the quadratic model was significant. Models appropriateness was also indicated by non-significance of lack of fit (Table 3). Similar results obtaining a decreasing trend with respect to temperature has also been reported for pomegranate seeds (Kingsly et al., 2006), paddy (Alizadeh et al., 2006), barley seeds (Aghajani et al., 2012) and Chironji (Buchanania lanzan) Nut (Kumar et al., 2016).
Table 2: Observed and predicted values of responses.
|
Run |
Length |
Width |
Thickness |
TKW |
Bulk density |
True density |
Porosity |
Hardness |
||||||||
|
Obs. |
Pred. |
Obs. |
Pred. |
Obs. |
Pred. |
Obs. |
Pred. |
Obs. |
Pred. |
Obs. |
Pred. |
Obs. |
Pred. |
Obs. |
Pred. |
|
|
1 |
6.96 |
6.96 |
3.53 |
3.52 |
2.48 |
2.48 |
32.57 |
32.56 |
798 |
797 |
1481 |
1480 |
46.12 |
46.18 |
35.52 |
35.48 |
|
2 |
6.91 |
6.92 |
3.57 |
3.55 |
2.45 |
2.46 |
31.87 |
31.82 |
786 |
791 |
1478 |
1479 |
46.82 |
46.53 |
37.72 |
37.35 |
|
3 |
6.86 |
6.84 |
3.43 |
3.44 |
2.40 |
2.38 |
30.13 |
30.02 |
759 |
756 |
1472 |
1473 |
48.44 |
48.66 |
41.01 |
41.46 |
|
4 |
6.68 |
6.68 |
3.30 |
3.30 |
2.25 |
2.24 |
26.97 |
26.83 |
703 |
706 |
1453 |
1456 |
51.62 |
51.48 |
45.87 |
45.99 |
|
5 |
6.89 |
6.90 |
3.48 |
3.48 |
2.42 |
2.43 |
31.28 |
31.33 |
777 |
780 |
1476 |
1477 |
47.36 |
47.15 |
39.43 |
39.16 |
|
6 |
6.78 |
6.77 |
3.38 |
3.40 |
2.32 |
2.32 |
28.46 |
28.56 |
746 |
741 |
1466 |
1464 |
49.11 |
49.40 |
43.49 |
43.68 |
|
7 |
7.00 |
6.99 |
3.56 |
3.58 |
2.52 |
2.51 |
33.32 |
33.33 |
810 |
808 |
1483 |
1484 |
45.38 |
45.53 |
33.25 |
33.55 |
|
8 |
6.73 |
6.74 |
3.36 |
3.35 |
2.28 |
2.30 |
27.87 |
28.01 |
720 |
720 |
1465 |
1463 |
50.85 |
50.78 |
44.27 |
43.89 |
|
9 |
6.84 |
6.84 |
3.42 |
3.41 |
2.38 |
2.38 |
29.79 |
29.62 |
752 |
756 |
1470 |
1470 |
48.84 |
48.61 |
41.64 |
41.63 |
|
10 |
6.85 |
6.84 |
3.43 |
3.41 |
2.37 |
2.38 |
28.93 |
29.62 |
763 |
756 |
1473 |
1470 |
48.20 |
48.61 |
40.90 |
41.63 |
|
11 |
6.83 |
6.84 |
3.40 |
3.41 |
2.39 |
2.38 |
29.91 |
29.62 |
749 |
756 |
1468 |
1470 |
48.98 |
48.61 |
41.94 |
41.63 |
|
12 |
6.84 |
6.84 |
3.41 |
3.41 |
2.39 |
2.38 |
29.56 |
29.62 |
759 |
756 |
1472 |
1470 |
48.44 |
48.61 |
41.69 |
41.63 |
|
13 |
6.83 |
6.84 |
3.39 |
3.41 |
2.38 |
2.38 |
29.89 |
29.62 |
755 |
756 |
1469 |
1470 |
48.60 |
48.61 |
42.00 |
41.63 |
Obs.: Observed; Pred.: Predicted.
Table 3: Regression equation, R2, Adj R2 and Lack of fit.
|
Response |
Equation |
R2 |
Adj. R2 |
Lack of fit |
|
Length |
6.84 - 0.048X1 - 0.089X2 - 0.032X1X2 - 8.750E -004X12 + 0.014X22 |
0.99 |
0.98 |
0.08 |
|
Width |
3.41 - 0.029X1 - 0.082X2 - 0.043X1X2 + 0.013X12 + 0.028X22 |
0.97 |
0.94 |
0.24 |
|
Thickness |
2.38 - 0.040X1 - 0.077X2 - 0.030X1X2 - 3.500E-003X12 + 0.011X22 |
0.98 |
0.97 |
0.11 |
|
TKW |
29.62 - 0.98X1 - 1.88X2 - 0.62X1X2 + 0.17X12 + 0.53X22 |
0.98 |
0.97 |
0.94 |
|
Bulk density |
755.60 - 13.98X1 - 31.16X2 - 11.00X1X2 + 2.51X12 + 4.26X22 |
0.98 |
0.97 |
0.52 |
|
True density |
1470.40 - 4.52X1 - 7.43X2 - 4.00X1X2 - 0.075X12 + 1.43X22 |
0.95 |
0.91 |
0.31 |
|
Porosity |
48.61 + 0.79X1 + 1.86X2 + 0.62X1X2 - 0.17X12 - 0.23X22 |
0.98 |
0.97 |
0.46 |
|
Hardness |
41.63 +1.60X1 + 3.65X2 + 0.67X1X2 - 0.11X12 - 1.46X22 |
0.99 |
0.93 |
0.41 |
Note: X1: Temperature, X2: Time.
Thousand kernel weight (TKW)
TKW when analyzed at different runs was found to be statistically different (p≤0.05). TKW decreased with increasing temperature and time, showing a linear relationship between them (Figure 2a), where the decrease in TKW was more influenced by time. Maximum TKW was observed for run 7 with 33.32 g and minimum for run 4 with 26.97 g (Table 2). Relationship between TKW and independent variable are presented in Table 3. Similar trend of decreasing TKW has been reported for neem nuts (Visvanathan et al., 1996), hackberry (Demir et al., 2002), hemp seed (Sacilik et al., 2003), paddy (Alizadeh et al., 2006) and paddy and white rice (Gharekhani et al., 2013).
Bulk density
A decrease in bulk density was observed with increasing temperature and time. Decreasing rate in weight due to moisture than fixed volume was the reason of decreasing bulk density, the impact of process indicators has been illustrated in Figure 2b. Fitted regression model (Table 3) demonstrates that the response was significantly affected by independent variables. Maximum bulk density with 810 kg m-3 was obtained at run 7 with the temperature at 55 ºC for 4.11 minutes, where minimum with 703 kg m-3 was obtained at run 4 with temperature at 65 ºC for 155 minutes. Similar findings has also been reported for pomegranate seeds (Kingsly et al., 2006), pistachio nut and its kernel (Kashaninejad et al., 2006) and paddy (Zareiforoush et al., 2011).
True density
True density likewise decreased with increasing temperature and time, response surface plot versus independent variable is shown in Figure 3a. The quadratic model was found suitable to be explained having 0.95 and 0.91 values for R2 and adjusted R2. The significance of model was further cross checked by lack of fit value which was found to be non-significant (Table 3). Maximum and minimum values with 1483 and 1453 kg m-3 were obtained for run 7 and 4 respectively. A decreasing trend with increasing temperature and time has also been reported for rice (Yadav et al., 2007), sweet corn seed (Coşkun et al., 2006) and paddy (Zareiforoush et al., 2011).
Porosity
Change in porosity is attributed to the change in bulk and true densities. Increasing trend was observed for porosity with increasing temperature and time. Maximum porosity with 51.62% was obtained for run 4 while minimum was 45.38 for run 7. The goodness of the model was indicated by values of R2 which was found to be 0.98. Appropriateness of the model was also checked by lack of fit, which was found to be non-significant (Table 3). Relationship between response and independent variables are illustrated in Figure 3b. Findings having similar results has also been reported for chickpea seeds (Konak et al., 2002), paddy (Alizadeh et al., 2006) and paddy and white rice (Gharekhani et al., 2013).
Hardness
Hardness increased with increasing temperature and time as shown in Figure 3c. Maximum hardness with 45.87 N was observed for run 4, where for minimum it was 33.25 for run 7. R2 and adjusted R2 values of hardness demonstrated the goodness of the model. It further was demonstrated by F-test, where ANOVA indicated prob>F less than F-value. Lack of fit which was non-significant also showed the significance of the current quadratic model. Findings of hardness has been studied by various and are in line with the results of pomegranate seeds (Kingsly et al., 2006), brown rice (Mohapatra and Bal, 2007) and paddy (Qin and Siebenmorgen, 2005; Li et al., 2018).
Optimization
Regression equations (Table 3) for obtaining the optimal values for independent variables and selected responses were solved using Design Expert software. The optimal condition predicted by RSM for independent variables temperature and time were 63 ºC and 142.5 min respectively and optimal predicted length, width, thickness, TKW, bulk density, true density, porosity and hardness under these conditions were 6.72mm, 3.32mm, 2.27mm, 27.38 g, 716.78 kg m-3, 1459.14 kg m-3, 51.24% and 45.26 N, respectively. The prediction of the model was verified by applying optimal conditions to the independent variables. The results obtained showed that RSM can be used to optimize physical properties of paddy as influenced by drying.
Conclusions and Recommendations
The present study aimed to study the effects of drying on physical properties of paddy using response surface methodology. The surface plots of all responses revealed that the physical properties of paddy had significantly been affected by process parameters. The responses having acceptable R2 and Adj. R2 values, non-significance of lack of fit and significance analysis of variance suitably described the fitness of model. Optimum values for responses were obtained by solving regression equations of independent variable using Design Expert software. Predicted optimum temperature and time were 63 ºC and 142.5 min respectively and predicted length, width, thickness, TKW, bulk density, true density, porosity and hardness under these conditions were 6.72mm, 3.32mm, 2.27mm, 27.38 g, 716.78 kg m-3, 1459.14 kg m-3, 51.24% and 45.26 N respectively. The results showed that model was valid for predicting and optimizing the responses. Central composite design of response surface methodology was successfully used, studying the dependence of physical properties of paddy. Current experimental information can be used by rice processing industries which are useful for designing equipment’s for post-harvest operations, storing and processing purposes.
Acknowledgements
The study was sponsored by Science and Technology Special Project of Jiangsu with Project Number SZ-YC2019002. The first author is thankful to China Scholarship Council (CSC) for providing all possible facilities during the study in China.
Novelty Statement
The physical properties had although been reported before, but the study on optimization and mathematical modeling of physical properties as affected by drying have never been carried out. The study was therefore carried out to fill the research gap.
Author’s Contribution
Shakeel Ahmed Soomro and Kunjie Chen conceived the idea and conducted the experiment. Sikandar Almani and Lal Bux provided technical input. Muhammad Sohail Memon and Farman Ali Chandio analysed the data. Khalil Ahmed Ibupoto, Shakeel Hussain Chattha and Zaheer Ahmed Khan helped in developing the methodology section and reviewed final manuscript. Shakeel Ahmed Soomro, Zubair Ahmed Soomro and Babar Mustafa Ansari wrote the manuscript.
Conflict of interest
The authors have declared no conflict of interest.
References
Aghaie, E., M. Pazouki, M.R. Hosseini, M. Ranjbar and F. Ghavipanjeh. 2009. Response surface methodology (RSM) analysis of organic acid production for Kaolin beneficiation by Aspergillus niger. Chem. Eng. J., 147(2–3): 245–251. https://doi.org/10.1016/j.cej.2008.07.008
Aghajani, N., E. Ansaripour and M. Kashanineja. 2012. Effect of moisture content on physical properties of barley seeds. J. Agric. Sci. Technol., 14(1): 161–172.
Alizadeh, M.R., S. Minaei, T. Tavakoli and M.H. Khoshtaghaza. 2006. Effect of de-awning on physical properties of paddy. Pak. J. Biol. Sci., 9(9): 1726–1731. https://doi.org/10.3923/pjbs.2006.1726.1731
Correa, P.C., F.S. Silva, C. Jaren, P.C.A. Junior and I. Arana. 2007. Physical and mechanical properties in rice processing. J. Food Eng., 79(1): 137–142. https://doi.org/10.1016/j.jfoodeng.2006.01.037
Coşkun, M.B., İ. Yalçın and C. Özarslan. 2006. Physical properties of sweet corn seed (Zea mays saccharata Sturt.). J. Food Eng., 74(4): 523–528. https://doi.org/10.1016/j.jfoodeng.2005.03.039
Coskuner, Y. and E. Karababa. 2007. Some physical properties of flax seed (Linumusitatissimum L.). J. Food Eng., 78(3): 1067–1073. https://doi.org/10.1016/j.jfoodeng.2005.12.017
Demir, F., H. Dogan, M. Ozcan and H. Haciseferogullari. 2002. Nutritional and physical properties of hackberry (Celtis australis L.). J. Food Eng., 54(3): 241–247. https://doi.org/10.1016/S0260-8774(01)00210-2
Gharekhani, M., M. Kashaninejad, A. Daraei-Garmakhany and A. Ranjbari. 2013. Physical and aerodynamic properties of paddy and white rice as a function of moisture content. Qual. Assur. Saf. Crop. Foods, 5(3): 187–197. https://doi.org/10.3920/QAS2012.0129
Gharibzahedi, S.M.T., S.M. Mousavi, A. Moayedi, A.T. Garavand and S.M. Alizadeh. 2010. Moisture dependent engineering properties of black cumin (Nigella sativa L.) seed. Agric. Eng. Int. CIGR e J., 12(1): 194–202.
Ghosh, D. and P.C. Hallenbeck. 2010. Response surface methodology for process parameter optimization of hydrogen yield by the metabolically engineered strain Escherichia coli DJT135. Bioresour. Technol., 101(6): 1820–1825. https://doi.org/10.1016/j.biortech.2009.10.020
Jain, R.K. and S. Bal. 1997. Properties of pearl millet. J. Agric. Eng. Res., 66(2): 85–91. https://doi.org/10.1006/jaer.1996.0119
Jamali, L.A., S.A. Soomro, A.A. Abro, Z.A. Khan and N.H. Walhari. 2016. Effect of grain moisture content on physico-engineering properties of wheat. J. Agric. Res., 54(4): 773–785.
Juliano, B.O., 1985. Chemistry and technology (2nd Ed.). St. Paul, MN, USA: American Association of Cereal Chemists.
Kashaninejad, M., A. Mortazavi, A. Safekordi and L.G. Tabil. 2006. Some physical properties of pistachio (Pistacia vera L.) nut and its kernel. J. Food Eng., 72(1): 30–38. https://doi.org/10.1016/j.jfoodeng.2004.11.016
Khuri, A.I. and J.A. Cornell. 1996. Response surfaces: Designs and analyses, Statistics: A series of textbooks and monographs, Marcel Dekker, New York, NY, USA, 2nd edition.
Kingsly, A.R.P., D.B. Singh, M.R. Manikantan and R.K. Jain. 2006. Moisture dependent physical properties of dried pomegranate seeds (Anardana). J. Food Eng., 75(4): 492–496. https://doi.org/10.1016/j.jfoodeng.2005.04.033
Konak, M., K. Carman and C. Aydin. 2002. PH postharvest technology: Physical properties of chick pea seeds. Biosyst. Eng., 82(1): 73–78. https://doi.org/10.1006/bioe.2002.0053
Kumar, J., P.K. Prabhakar, P.P. Srivastav and P.K. Bhowmick. 2016. Moisture dependent physical properties of chironji (Buchanania lanzan) nut. J. Agric. Eng., 53(2): 45–54.
Li, Y., F.A. Chandio, Z. Ma, M. Zaman, B. Li, T.N. Syed, U. Farooq and S.A. Soomro. 2018. Post harvesting technology: effects of moisture content and loading speed on shearing failure of paddy grains. Int. Agric. Eng. J., 27(3): 342–349.
Liu, K., X. Cao, Q. Bai, H. Wen and Z. Gu. 2009. Relationships between physical properties of brown rice and degree of milling and loss of selenium. J. Food Eng., 94(1): 69–74. https://doi.org/10.1016/j.jfoodeng.2009.03.001
Mohapatra, D., and S. Bal. 2007. Effect of degree of milling on specific energy consumption, optical measurements and cooking quality of rice. J. Food Eng., 80(1): 119–125. https://doi.org/10.1016/j.jfoodeng.2006.04.055
Mohsenin, N.N., 1986. Physical properties of plant and animal materials (2nd Edn.). New York: Gordon and Breach.
Molenda, M., M.D. Montross, J. Horabik and I.J. Ross. 2002. Mechanical properties of corn and soybean meal. Trans. Am. Soc. Agric. Eng., 45(6): 1929–1936.
Montgomery, D.C., 2005. Design and analysis of experiments: Response surface method and designs. Wiley Press, Hoboken, N.J., USA.
Muthayya, S., J.D. Sugimoto, S. Montgomery and G.F. Maberly. 2014. An overview of global rice production, supply, trade, and consumption. Ann. N. Y. Acad. Sci., 1324(1): 7–14. https://doi.org/10.1111/nyas.12540
Olajide, J.O., B.I.O. Ade-Omowaye and E.T. Otunola. 2000. Some physical properties of shea kernel. J. Agric. Eng. Res., 76(4): 419–421. https://doi.org/10.1006/jaer.1999.0510
Qin, G. and T.J. Siebenmorgen. 2005. Harvest location and moisture content effect on rice kernel-to-kernel breakage force distributions. Appl. Eng. Agric., 21(6): 1011–1016. https://doi.org/10.13031/2013.20016
Sacilik, K., R. Oztruk and R. Keskin. 2003. Some physical properties of hemp seed. Biosyst. Eng., 86(2): 191–198. https://doi.org/10.1016/S1537-5110(03)00130-2
Sahay, K.M. and K.K. Singh. 1994. Unit operations of agricultural processing (1st Edn.). Vikas Publishing House Pvt. Ltd., New Delhi, India.
Shittu, T.A., M.B. Olaniyi, A.A. Oyekanmi and K.A. Okeleye. 2012. Physical and water absorption characteristics of some improved rice varieties. Food Bioprocess Technol., 5(1): 298–309. https://doi.org/10.1007/s11947-009-0288-6
Soomro, S.A., S.A. Thebo and K. Chen. 2018. Physico-engineering properties of different rice varieties grown in Sindh province of Pakistan. Int. Agric. Eng. J., 27(1): 275–280.
Suthar, S.H. and S.K. Das. 1996. Some physical properties of karingda seeds. J. Agric. Eng. Res., 65(1): 15–22. https://doi.org/10.1006/jaer.1996.0075
Tavakoli, M., H. Tavakoli, A. Rajabipour, H. Ahmadi and S.M.T. Gharibzahedi. 2009. Moisture-dependent physical properties of barley grains. Int. J. Agric. Biol. Eng., 2(4): 84–91.
Thompson, S.A. and I.J. Ross. 1983. Compressibility and frictional coefficient of wheat. Trans. Am. Soc. Agric. Eng., 26: 1171–1176. https://doi.org/10.13031/2013.34099
Visvanathan, R., P.T. Palanisamy, L. Gothandapani and V.V. Sreenarayanan. 1996. Physical properties of neem nut. J. Agric. Eng. Res., 63(1): 19–25. https://doi.org/10.1006/jaer.1996.0003
Yadav, R.B., B.S. Khatkar and B.S. Yadav. 2007. Morphological, physicochemical and cooking properties of some Indian rice (Oryza sativa L.) cultivars. J. Agric. Technol., 3(2): 203–210.
Yousaf, K., A. Abbas, X. Zhang, S.A. Soomro, M. Ameen, C. Arslan and Z. Xuejin. 2018. Effect of multi-stage drying on energy consumption, the rate of drying, rice quality and its optimization during parboiling process. Fresenius Environ. Bull., 27(12): 8270–8279.
Yousaf, K., C. Kunjie, C. Cairong, A. Abbas, Y. Huang, and K. Chen. 2017. The optimization and mathematical modeling of quality attributes of parboiled rice using a response surface method. J. Food Qual., pp. 5960743. https://doi.org/10.1155/2017/5960743
Zareiforoush, H., B. Hosseinzadeh, M.E. Adabi and A. Motavali. 2011. Moisture-dependent physical properties of paddy grains. J. Am. Sci., 7(7): 175–182.
To share on other social networks, click on any share button. What are these?