Irrigation Water Characteristics, Their Correlations and Suitability for Agriculture in District Gujranwala (A Survey Study)


Research Article
Irrigation Water Characteristics, Their Correlations and Suitability for Agriculture in District Gujranwala (A Survey Study)
Abid Ali1*, Safia Naureen Malik3, Muhammad Akmal2, Hafeez Ullah Rafa2 and Abid Subhani3
1Soil and Water Conservation Research Station, Fateh Jang, Pakistan; 2Institute of Soil Science, PMAS- Arid Agriculture University Rawalpindi, Pakistan; 3Soil and Water Conservation Research Institute, Chakwal, Pakistan.
Abstract | A survey study was conducted in Gujranwala district to evaluate the quality of groundwater for agriculture purpose. A total of 565 groundwater samples were collected from farmers’ tube wells during random survey of four tehsils of Gujranwala district, i.e., Gujranwala, Kamoke, Wazirabad and Noshera Virkan. The water samples were analyzed in Soil and Water Testing Laboratory Gujranwala for electrical conductivity (EC), sodium adsorption ratio (SAR), residual sodium carbonate (RSC), chloride (Cl) and sodium (Na) of the groundwater. The results revealed that out of 565 samples, 231 (41%) were fit; 149 (26%) were marginally fit, and; 185 (33%) were unfit regarding their quality. The maximum samples were found unfit for high RSC followed by EC and combined effect of EC and RSC, implying that use of such groundwater for irrigation may be a cause of salinity as well as sodicity for soils of the district. The ‘maximum values’ of Cl ion and ‘mean values’ of Na ion were observed higher than their permissible values (4 me L-1 and 3 me L-1 respectively) in all the four tehsils, indicating that groundwater is toxic to crop growth at certain locations of the district. The data manifested that the quality deciding parameters i.e., EC, SAR and RSC of irrigation water were statistically positively correlated (p <0.01) with each other having coefficient of correlation r = 0.685, 0.540, 0.597 for EC; SAR, EC; RSC and SAR; RSC respectively. From these results, it was concluded that RSC is the major factor for unfitness of water quality in Gujranwala district followed by EC and SAR, whereas, toxicity of groundwater to crop growth due to Cl and Na ions is also worth-considering.
Received | January 15, 2021; Accepted | May 18, 2022; Published | June 28, 2022
*Correspondence | Abid Ali, Soil and Water Conservation Research Station, Fateh Jang, Pakistan; Email: aliabid1965@yahoo.com
Citation | Ali, A., S.N. Malik, M. Akmal, H.U. Rafa and A. Subhani. 2022. Irrigation water characteristics, their correlations and suitability for agriculture in district Gujranwala (A survey study). Pakistan Journal of Agricultural Research, 35(2): 303-310.
DOI | https://dx.doi.org/10.17582/journal.pjar/2022/35.2.303.310
Keywords | Groundwater quality, Gujranwala district, Electrical conductivity (EC), Sodium adsorption ratio (SAR), Residual sodium carbonate (RSC)
Copyright: 2022 by the authors. Licensee ResearchersLinks Ltd, England, UK.
This article is an open access article distributed under the terms and conditions of the Creative Commons Attribution (CC BY) license (https://creativecommons.org/licenses/by/4.0/).
Introduction
Population of Pakistan was estimated as 211.17 million in 2019. In 2019-20, agriculture sector contributed as 19.31% alone, and 38.60% combined with industrial sector to the GDP of the country, because most of the industry in the country is also agro-based (GOP, 2020). It was estimated that agriculture sector employed country’s work-force as 38.5% alone, and 62.2% combined with industrial sector in 2017-18 (GOP, 2018).
Water is the basic need for agricultural activities. It was estimated that the agriculture sector (crops + livestock) consumed around 94 percent of the total water annually available in 2008 (183.421 km3), followed by municipalities and industry which consumed 5 and 1 percent respectively (Frenken, 2012). Hence, agriculture is the largest consumer of water available in the country. In 2018-19, out of total 22.15 million ha cultivated area 19.32 million ha (87.22%) was sown with different irrigation sources whereas the remaining area (12.78%) was cultivated with rain-water. Out of 19.32 million ha, 6.63 million ha (34.32%) was commanded by canals, 3.57 million ha (18.48%) by tube wells and 8.19 million ha (42.4%) by canals plus tubewells (GOP, 2020). It was estimated that water-managed area contributed more than 90% to the total crop production of the country (Mahmood et al., 2015; UNDP, 2017; Qureshi et al., 2010).
Since, the surface water (canals) cannot alone cater for the irrigational needs, therefore, the role of tube well water is very crucial in the country. That is why, 52 MAF (million-acre feet) groundwater had to be abstracted by 1391277 tube wells for cultivation of different crops in 2017-18 (GOP, 2019). This large number grew to this extent from 163208 tube wells within only 17 years in 2000-01 in the country (GOP, 2019). Hence, tendency of dependence on tube well water has tremendously been increased over the time. However, simultaneous with enormous benefits of tube well water, there had been many reservations in its use for irrigational purpose as well, among which, poor quality of 70 % groundwater is of paramount importance (Latif and Ahmed, 2008; Hanan, 2012), which may negatively impact crop production through direct osmotic stress, and indirect soil salinization (Kahlown et al., 2003; Riaz et al., 2018).
Ali et al. (2009) analyzed groundwater samples of 20 villages of Lahore district and found unfitness of 28 samples (46.6%), 19 samples (31.6%), 44 samples (73.3%) and 10 samples (16.6%) on the basis of EC, SAR, RSC and Cl ion respectively. Khattak et al. (2012) analyzed 33 groundwater samples adjacent to Hadiara industrial drain Lahore out of which 79% samples were found as unfit for irrigation of agricultural crops. They found that high SAR and RSC caused unfitness of 24.3% and 82% samples respectively. However, the chloride level of only 3% samples exceeded to the permissible limit. Maqsood et al. (2016) analyzed 71 groundwater samples from different locations of Hafizabad district and found 08 (11.27%) samples as unfit for irrigation purpose. The unfitness of these samples was caused by high EC and RSC. Awais et al. (2017) collected groundwater samples from 289 points of 8042.83 km2 area of Lower Chenab Canal at times pre-monsoon and post-monsoon. They analyzed the samples and found as unfit of 846 km2 (10.53%) for pre-monsoon time whereas 798.33 km2 (9.93%) for post-monsoon time. They further found that maximal contribution to unfitness was imparted by RSC. Riaz et al. (2018) analyzed 3326 groundwater samples in Bahawalpur tehsil out of which 52.78% came out to be unfit. Electrical conductivity, SAR and RSC contributed to unfitness as 34%, 21% and 7% respectively. The researchers have reported that the waters with high value of EC and RSC can be used under regular monitoring and by adopting special irrigation and management techniques (Ayers and Westcot, 1985; Nishanthiny et al., 2010) to avoid salinization of agricultural lands. In 2001-2004, out of total 41721884 acres (16.89 million ha) of agricultural land surveyed 11803544 (4.78 million ha) (27%) land was found as salt-affected of different categories (GOP, 2019).
In the light of available information, this study was undertaken to know the quality characteristics of groundwater water in different tehsils of Gujranwala. The objective of the study was to find out relationship among different irrigation water quality parameters so that groundwater could safely be applied to soil and agricultural crop by adopting different management techniques.
Materials and Methods
A survey study to monitor the groundwater quality for irrigation use was conducted in Gujranwala district which is located in 32.1877°N, 74.1945°E. From four tehsils of Gujranwala district, 565 water samples were collected in following numbers: 204 samples from tehsil Gujranwala, 156 samples from tehsil Kamoke, 127 samples from tehsil Wazirabad, and 78 samples from tehsil Noshera Virkan respectively, by pumping out water after operating tube wells for 20-30 minutes prior to collecting water samples. These samples were randomly collected from farmers’ tube wells in the four tehsils of district Gujranwala. The collected water samples were stored in sterile plastic/glass bottles tightly fitted with bottle cap. Each bottle was properly labeled showing the name, location and sampling date. These samples were analyzed for EC, Ca, Mg, Na, CO3, HCO3, and Cl following the standard analytical procedures, as given in Table 1, at Soil and Water Testing Laboratory, Gujranwala. Electric Conductivity (EC) was determined by EC meter. While CO3, HCO3 was determined by titration with H2SO4. Whereas, Cl was determined by titration with AgNO3 and Ca, Mg was determined by titration with EDTA.
Table 1: Analysis techniques with references.
|
Parameters |
Technique |
Reference |
|
pH |
pH meter |
Richards (1954) |
|
Electrical conductivity |
Conductivity meter |
Richards (1954) |
|
Na and K |
Flame photometer |
Richards (1954) |
|
Ca, Mg, CO3, HCO3 and Cl, |
Titrimetric method |
APHA (2000) |
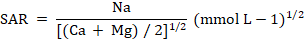
The data regarding sodium adsorption ration (SAR) and residual sodium carbonate (RSC) was derived using the following formulae (Richards, 1954).
RSC (meq L-1) = [CO3 + HCO3 (meq L-1)] – [Ca + Mg (meq L-1)]
The results obtained for EC, SAR and RSC of analyzed water-samples were categorized for their quality fitness/unfitness following the criteria as being adopted in agriculture department of the Punjab (Malik et al., 1984), which is given in Table 2. The toxicity criteria for Cl and Na elements concentration in irrigation water is presented in Table 3.
Table 2: Criteria for quality of irrigation water.
|
Parameters |
Fit |
Marginally fit |
Unfit |
|
EC (µScm-1) |
<1000 |
1000 - 1250 |
>1250 |
|
RSC (me L-1) |
<1.25 |
1.25 - 2.25 |
>2.25 |
|
SAR (mmol L-1) |
<6 |
6 - 10 |
>10 |
|
Cl (me L-1) |
<3.9 |
- |
>3.9 |
|
Na (me L-1) |
<3 |
- |
>3 |
(Malik et al., 1984).
Table 3: Criteria for specific ion toxicity of irrigation water.
|
Parameters |
Non toxic |
Toxic |
|
Cl (meL-1) |
<4 |
>4 |
|
Na (meL-1) |
<3 |
>3 |
(Ayers and Westcot. 1985).
The data obtained was analyzed statistically for percent, mean, and standard deviation following the methods of Steel and Torrie (1980).
Results and Discussion
As is obvious from Figure 1, in total 565 water samples were analyzed for EC, SAR and RSC parameters. It was found that out of 565 water samples, 231 (40.88%) were fit; 149 (26.37%) marginally fit, and; 185 (32.74%) unfit for irrigation of cultivated land. These results are in line with those of Latif and Ahmad (2008), Hannan (2012) and Khattak et al. (2012) who reported unfitness of groundwater up to 79% in their studies.
The tehsil-wise classification of water quality of Gujranwala district has been presented in Figure 2. It was observed that in total 204, 156, 127 and 78 water samples were collected from tehsil Gujranwala, Kamoki, Waziabad, Nowshera Virkan respectively the analysis of which showed the order for fitness as follows: Wazirabad (51.18%) > Gujranwala (42.65%) > Nowshera Virkan (41.03%) > Kamoki (30.13%). The order for marginal fitness remained as follows: Wazirabad (30.71%) > Kamoki (27.56%) > Gujranwala (25%) > Nowshera Virkan (20.51%). The order for unfitness of samples was revealed as follows: Wazirabad (18.11%) < Gujranwala (32.35%) < Nowshera Virkan (38.46%) < Kamoki (42.31%).
The detail of unfitness of water samples on the basis of EC, SAR and RSC in different tehsils of Gujranwala district are presented in Table 4. As has been manifested in Figure 1, 32.43% of the total analyzed samples were unfit out of which 95.68% had become unfit due to high EC, RSC and EC+RSC in four tehsils of Gujranwala district. For example, EC, RSC and EC+RSC caused unfitness of samples in Gujranwala, Kamoke, Wazirabad and Noshehra Virkan as 20.55, 42.70 and 32.43 percent. Hence, RSC is the biggest contributor to unfitness of groundwater in Gujranwala district followed by EC+RSC and EC. When analyzed data of unfit samples was reviewed separately for each tehsil it came out that 16.67, 30.30, 13.04 and 13.33 percent of total unfit samples of Gujranwala, Kamoke, Wazirabad and Noshehra Virkan tehsils became unfit by EC, respectively. Hence, groundwater of Kamoke tehsil was found most saline followed by Gujranwala tehsil. The other two Tehsil of Wazirabad and Noshehra Virkan were found almost at par for salinity hazard of groundwater. Similarly, 42.42, 34.85, 56.52 and 50.00 percent of total unfit samples of Gujranwala, Kamoke, Wazirabad and Noshehra Virkan tehsils were turned unfit by RSC, respectively. It implies that RSC problem is most severe in Wazirabad followed by Noshehra Virkan, Gujranwala and Kamoke tehsils. The holistic picture of this detail depicts the fact that 32.74% of total groundwater of Gujranwala district is unfit mainly due to EC and RSC, whereas, SAR is not a significant contributor to the unfitness. These results have similarity with those of Maqsood et al. (2016) and Awais et al. (2017) who found high EC and RSC values as major unfitness causing agents of groundwater in their scientific studies.
Table 4: Unfit water-samples (%) in different tehsils of district Gujranwala on the basis of EC, SAR and RSC values.
|
Tehsil |
EC |
SAR |
RSC |
EC+ SAR |
EC+ RSC |
SAR+ RSC |
EC+ SAR+ RSC |
|
Gujranwala |
16.67 |
0 |
42.42 |
0 |
33.33 |
3.03 |
4.55 |
|
Kamoke |
30.30 |
0 |
34.85 |
0 |
34.85 |
0 |
0 |
|
Wazirabad |
13.04 |
0 |
56.52 |
8.70 |
17.39 |
0 |
4.35 |
|
Noshera |
13.33 |
0 |
50.00 |
0 |
36.67 |
0 |
0 |
|
Total |
20.55 |
0 |
42.70 |
1.08 |
32.43 |
1.08 |
2.16 |
Table 5 explains the details of minimum and maximum limits/concentrations of quality and toxicity parameters of groundwater in different tehsils of district Gujranwala. For example, EC ranged as 0.0065-2.98 (Mean 0.91), 0.47-2.08 (Mean 1.05), 0.42-12.16 (Mean 0.99) and 0.12-2.5 (Mean 1.00) for Gujranwala, Kamoke, Wazirabad and Noshehra Virkan, respectively; SAR ranged as 1.1-20.23 (Mean 4.99), 1.11-9.96 (Mean 3.51), 0.42-12.16 (Mean 0.99) and 0.12-2.5 (Mean 1.00) for Gujranwala, Kamoke, Wazirabad and Noshehra Virkan respectively, and; RSC ranged as 0.05-9.2 (Mean 2.43), 0.02-11.7 (Mean 2.1), 0.02-10.9 (Mean 1.8) and 0.09-11.68 (Mean 2.47) for Gujranwala, Kamoke, Wazirabad and Noshehra Virkan respectively. The values for Cl ion concentration ranged as 0.1-10.5 (Mean 1.17), 0.1-6.9 (Mean 1.31), 0.1-68.6 (Mean 1.8) and 0.2-6.0 (Mean 1.29) for Gujranwala, Kamoke, Wazirabad and Noshehra Virkan, respectively, whereas, the values for Na concentration ranged from o.16-23.15 (Mean 4.34), 0.17-15.15 (Mean 5.47), 0.25-93.1 (Mean 5.1) and 0.29-16.92 (Mean 4.84) for Gujranwala, Kamoke, Wazirabad and Noshehra Virkan, respectively. The aforementioned maximum values of EC, SAR, RSC, Cl and Na show that the groundwater at certain locations of Gujranwala district is not only of poor quality but also toxic to many agricultural crops. Such water, if applied in un-monitored and un-managed manner, may not only deteriorate agricultural lands turning them salt-affected but also markedly reduce crop production due to osmotic stress in all the four tehsils of Gujranwala district. These results are similar to those of Maqsood et al. (2016) and Awais et al. (2017) who found high EC and RSC values as major unfitness causing agents of groundwater in their scientific studies. The results also resemble to those of Ali et al. (2009) and Khattak et al. (2012) who found Cl in excess concentration in groundwater (17% and 3%, respectively) than its permissible limit.
Since, maximum percentage of samples got unfit on the basis of RSC, therefore, there is a need to take view of analysis data of Ca+Mg and CO3+HCO3 in the four tehsils. It was observed that CO3 was not a big contributor to RSC, whereas, HCO3 had been the remarkable contributor to RSC in all the tehsils of Gujranwala district. It was further observed that in Gujranwala and Noshehra Virkan tehsils the minimum and maximum values of CO3+HCO3 exceeded to Ca+Mg values. However, in Kamoke tehsil only maximum value, whereas, in Wazirabad tehsil only minimum values of CO3+HCO3 exceeded to Ca+Mg values. But the most important point in this regard is that mean values of CO3+HCO3 exceeded to Ca+Mg values in all the four tehsils of Gujranwala district. This detail has been presented in Table 5.
Table 5a: Minimum and maximum limits/concentrations of quality and toxicity parameters of groundwater in different tehsils of district Gujranwala.
|
Parameters |
Gujranwala |
Kamoke |
Wazirabad |
Noshera Virkan |
|
EC (dS m-1) |
||||
|
Minimum |
0.001 |
0.47 |
0.42 |
0.12 |
|
Maximum |
2.98 |
2.08 |
12.16 |
2.50 |
|
SD |
0.38 |
0.38 |
1.07 |
0.38 |
|
Mean |
0.91 |
1.05 |
0.99 |
1.00 |
|
Median |
0.84 |
1.01 |
0.83 |
0.96 |
|
SAR (mmol L-1)1/2 |
||||
|
Minimum |
1.1 |
1.11 |
0.14 |
0.17 |
|
Maximum |
20.23 |
9.96 |
24.66 |
9.39 |
|
SD |
2.58 |
2.22 |
3.0 |
1.92 |
|
Mean |
4.99 |
3.51 |
3.2 |
3.06 |
|
Median |
2.56 |
3.29 |
2.74 |
3.20 |
|
RSC (me L-1) |
||||
|
Minimum |
0.05 |
0.02 |
0.02 |
0.09 |
|
Maximum |
9.2 |
11.7 |
10.9 |
11.68 |
|
SD |
1.86 |
1.98 |
1.7 |
0.34 |
|
Mean |
2.43 |
2.1 |
1.8 |
2.47 |
|
Median |
2.1 |
1.6 |
1.4 |
1.8 |
|
Cl (me L-1) |
||||
|
Minimum |
0.1 |
0.1 |
0.1 |
0.2 |
|
Maximum |
10.5 |
6.9 |
68.6 |
6.0 |
|
SD |
1.25 |
1.13 |
6.2 |
0.98 |
|
Mean |
1.17 |
1.31 |
1.8 |
1.29 |
|
Median |
0.7 |
1.0 |
0.7 |
1.1 |
|
Na (me L-1) |
||||
|
Minimum |
0.16 |
0.17 |
0.25 |
0.29 |
|
Maximum |
23.15 |
15.15 |
93.1 |
16.92 |
|
SD |
3.28 |
3.40 |
8.6 |
3.16 |
|
Mean |
4.34 |
5.47 |
5.1 |
4.84 |
|
Median |
3.91 |
4.9 |
3.8 |
4.9 |
There are three kind of hazards associated with irrigation water quality. They are: (1) salinity hazard; (2) sodicity hazard, and; (3) toxicity hazard. They are commonly interpreted through five criteria of water quality fitness, i.e. EC, SAR, RSC, C and Na. The groundwater with standard quality parameter should be used for irrigation under regular monitoring and adoption of special management techniques (Ayers and Westcot, 1985; Nishanthiny et al., 2010).
Table 5b: Minimum, maximum, and mean value of different quality parameters of water samples in district Gujranwala.
|
Tehsil name |
Ca+Mg (me L-1) |
CO3 (me L-1) |
HCO3 (me L-1) |
CO3+HCO3 (me L-1) |
|
|
Gujranwala |
Min |
0.4 |
0.04 |
1.22 |
1.26 |
|
Max |
9.9 |
1.6 |
13.76 |
15.36 |
|
|
SD |
1.80 |
0.65 |
2.59 |
||
|
Mean |
4.73 |
0.59 |
6.56 |
||
|
Kamoke |
Min |
1.9 |
0.19 |
0.3 |
0.49 |
|
Max |
11.5 |
0.2 |
14.8 |
15.00 |
|
|
SD |
1.47 |
0.01 |
2.22 |
||
|
Mean |
4.98 |
0.20 |
6.55 |
||
|
Wazirabad |
Min |
01.5 |
2 |
0.3 |
2.30 |
|
Max |
97 |
2 |
14 |
16.00 |
|
|
SD |
08.6 |
- |
2.2 |
||
|
Mean |
0 5.6 |
2.0 |
5.9 |
||
|
Noshera Virkan |
Min |
2.2 |
0 |
2.4 |
2.40 |
|
Max |
8.94 |
0 |
19.8 |
19.80 |
|
|
SD |
1.48 |
0 |
3.06 |
||
|
Mean |
5.28 |
0 |
7.27 |
The first kind of problem, i.e. the salinity problem, appears when the high quantity of salts is dissolved in irrigation water leading to accumulation of salts in the root zone and causing osmotic stress to the crop. The salinity level of an irrigation water can be determined directly by evaporation of a known quantity of water and measuring the residue of dissolved salts that remain behind. An indirect and a more common method of determining the salt content of an irrigation water is to measure its electrical conductivity (EC). The greater the conductivity, the greater is its salt content.
Second kind of problem, i.e. the sodicity problem, is often confronted in the form of poor infiltration and inadequate permeability of water in soil. The problem develops through long-term and unschematic application of irrigation water bearing high concentration of sodium relative to calcium and magnesium. Sodicity causes swelling and dispersion of soil clays, surface crusting and pore plugging. This degraded soil structure condition in turn obstructs infiltration, enhances water runoff and restricts root growth. The most common measure for assessment of sodicity in water and soil is done by calculating sodium adsorption ratio (SAR). The SAR defines sodicity in terms of the relative concentration of sodium (Na) compared to the sum of calcium (Ca) and magnesium (Mg) ions in a sample. The SAR assesses the potential for infiltration problems due to a sodium imbalance in irrigation water. Residual Sodium Carbonate (RSC) is another index of the sodicity hazard of irrigation water. High carbonate (CO3-2) and bicarbonate (HCO3-1) in irrigation water increase SAR index in the soil. Bicarbonate and carbonate ions combined with calcium and magnesium leading to their precipitation and raising the proportion of sodium ions than calcium and magnesium. When dissolved sodium in comparison with dissolved calcium and magnesium is higher in water, clay soil succumbs to dispersion and in turn swelling which drastically reduces infiltration and permeability of soil. The plant roots become unable to spread vertically as well as horizontally in the soil due to its hardness in addition to sufferance from severe moisture stress.
Third kind of problem, i.e., toxicity problem related to water quality, occurs when Cl and Na are found in irrigation water in excessive concentration. Though these are essential elements for plant growth but they are required in very small amounts to the plants. When their concentration in irrigation water increases the crop yield inversely decreases due their toxic effect on the crop growth. The decrease in yield is more drastic in crops which are sensitive to these elements.
Pearson correlation coefficient for irrigation water parameters is presented in Table 6. It is evident from the data that the quality deciding parameters i.e. EC, SAR and RSC of irrigation water were positively correlated (p <0.01) with each other expressing coefficient of correlation r = 0.685, 0.540, 0.597 for EC; SAR, EC; RSC and SAR; RSC respectively. Data suggested that EC, SAR and RSC in irrigation water are positively correlated with each other in irrigation samples. Similar results were reported by (Pervaiz et al., 2002) where a highly significant correlation existed among EC, SAR and RSC. Carbonates (CO3) in irrigation water were non-significantly correlated with EC. A significantly positive correlation also existed between SAR, Na, HCO3 and Cl having coefficient of correlations at p <0.01, with r = 0.825, 0.341 and 0.479. Sodium adsorption ratio (SAR) of irrigation water is non-significantly correlated with CO3 and negatively correlated with Ca + Mg. Residual sodium carbonate (RSC) in irrigation water was statistically positively correlated with coefficient of correlation values r = 0.638, 0.739 and 0.246 at p <0.01 for Na, HCO3 and Cl. Negative coefficient of correlation exists between RSC and Ca + Mg in irrigation water.
Table 6: Pearson correlation analysis of irrigation water characteristics.
|
Parameters |
EC (dS m-1) |
Ca + Mg (me L-1) |
Na (me L-1) |
CO3 (me L-1) |
HCO3 (me L-1) |
Cl (me L-1) |
SAR (mmol L-1)1/2 |
RSC (me L-1) |
|
|
EC |
CC |
1 - |
|||||||
|
Sig. (P-value) |
|||||||||
|
Ca + Mg (me/l) |
CC |
.418** |
1 - |
||||||
|
Sig. (P-value) |
.000 |
||||||||
|
Na (me/l) |
CC |
.951** |
.305** |
1 - |
|||||
|
Sig. (P-value) |
.000 |
.000 |
|||||||
|
CO3 (me/l) |
CC |
.498 |
-.506 |
.851** |
1 - |
||||
|
Sig. (P-value) |
.143 |
.135 |
.002 |
||||||
|
HCO3 (me/l) |
CC |
.401** |
.215** |
.338** |
.528 |
1 - |
|||
|
Sig. (P-value) |
.000 |
.000 |
.000 |
.117 |
|||||
|
Cl (me/l) |
CC |
.833** |
.240** |
.809** |
.358 |
.078 |
1 - |
||
|
Sig. (P-value) |
.000 |
.000 |
.000 |
.309 |
.064 |
||||
|
SAR |
CC |
.685** |
.105* |
.825** |
.845** |
.341** |
.479** |
1 - |
|
|
Sig. (P-value) |
.000 |
.012 |
.000 |
.002 |
.000 |
.000 |
|||
|
RSC |
CC |
.540** |
-.038 |
.638** |
.660 |
.739** |
.246** |
.597** |
1 - |
|
Sig. (P-value) |
.000 |
.404 |
.000 |
.154 |
.000 |
.000 |
.000 |
||
CC: Pearson correlation coefficient (r); **: Correlation is significant at the 0.01 level (2-tailed); *: Correlation is significant at the 0.05 level (2-tailed).
Conclusions and Recommendations
The irrigation with poor quality water of high salt concentration can cause salt accumulation in agricultural lands and salt stress in root zone leading to degradation of soil quality and low crop yield. Therefore, it is imperative to test the water quality before its selection for irrigation. Regular monitoring of quality characteristics of groundwater/tube well water should be made for safety of the soils’ productivity and harvest of high crop yield. High carbonates and bicarbonates in water (RSC) is the major factor for unfitness/ quality of irrigation water in the study area followed by EC. The quality parameters of irrigation water i.e., EC, SAR and RSC have some positive correlation in the surveyed area depicting dependency on each other. It is recommended that after qualifying the type of problem in the water samples, appropriate site-specific management should be adopted. It includes application of gypsum and organic amendments or their integrated use for treatment of RSC. The total salt content in irrigation waters can be managed through dilution with good quality ground or canal water. Over all such studies will provide the baseline data to the farmers for safe use of irrigation water / to value their input cost and identify future water research areas for water quality research in Pakistan.
Novelty Statement
Quality of water used for irrigation purpose is very much important for agriculture sector.
Author’s Contribution
Abid Ali: Supervised the research work and wrote initial draft.
Safia Naureen Malik: Assisted in write up of the draft, compiled the data and submitted the manuscripg.
Muhammad Akmal: Gave technical input and analysed the data.
Hafeez Ullah Rafa: Assisted in data analysis and results and discussion.
Abid Subhani: Reviewed and edited the final draft.
Conflict of interest
The authors have declared no conflict of interest.
References
Ali, M.S., S. Mahmood, M.N. Chaudhry and M. Sadiq. 2009. Irrigation quality of ground water of twenty villages in Lahore District. Soil Environ., 28(1): 17-23.
Awais, M., M. Arshad, S.H.H. Shah and M.A. Haq. 2017. Evaluating groundwater quality for irrigated agriculture: Spatio-temporal investigations using GIS and geostatistics in Punjab, Pakistan. Arab J. Geosci., 10: 510. https://doi.org/10.1007/s12517-017-3280-x
Ayers, R.S. and D.W. Westcot. 1985. Water quality for agriculture. FAO irrigation and drainage paper. 29. Rev. 1. Food and Agriculture Organization of the United Nations, Rome. Available at: http://www.fao.org/3/t0234e/T0234E01.htm#ch1.2.1
Frenken, K., 2012. Irrigation in Southern and Eastern Asia in figures. AQUASTAT Survey-2011. FAO Water Report 37. FAO Land and Water Division. Rome.
GOP, 2018. Labour force survey 2017-18. Pakistan Bureau of Statistics, Ministry of Statistics, Islamabad.
GOP, 2019. Agricultural Statistics of Pakistan 2017-18. Ministry of National Food security and Research. Islamabad. Available at: http://www.mnfsr.gov.pk/frmDetails.aspx
GOP, 2020. Pakistan economic survey 2019-20. Economic Advisor’s Wing, Finance Division, Islamabad.
Hannan, I., 2012. Groundwater level and quality monitoring in Punjab. Annual Report. Directorate of Land Reclamation Punjab, Lahore, Pakistan.
Kahlown, M.A., M.A. Tahir and M. Ashraf. 2003. Water quality issues and status in Pakistan. Proceedings of seminar on strategies to address the present and future water quality issues. Pakistan Council of Research in Water Resources Islamabad. Publication No. 123-2003.
Khattak, M.A., N. Ahmad, M.A. Qazi, A. Izhar, S. Ilyas, M.N. Chaudhary, M.S.A. Khan, N. Iqbal and T. Waheed. 2012. Evaluation of ground water quality for irrigation and drinking purposes of the areas adjacent to Hudiara Industrial Drain, Lahore, Pakistan. Pak. J. Agric. Sci., 49(4): 549-556.
Latif, M., and M.Z. Ahmad. 2008. Groundwater and soil salinity variations in a canal command area in Pakistan. Irrig. Drain., 58: 456-468. https://doi.org/10.1002/ird.417
Mahmood, A., T. Oweis, M. Ashraf, A. Majid, M. Aftab, N.K. Aadala and I. Ahmad. 2015. Performance of improved practices in farmers’ fields under rainfed and supplemental irrigation systems in a semi-arid area of Pakistan. Agric. Water Manage., 155: 1-10. https://doi.org/10.1016/j.agwat.2015.03.006
Malik, D.M., M.A. Khan and T.A. Chaudhry. 1984. Analysis method for soil, plant, and water. Soil Fertility Survey and Soil Testing Institute, Punjab, Lahore, Pakistan.
Maqsood, T., N. Ahmad, N.K. Buksh and M. Shafiq. 2016. Assessment of groundwater quality for irrigation in Hafizabad District, Punjab, Pakistan. Agric. Res. Tech. Open Access J., 2(5): 555597. https://doi.org/10.19080/ARTOAJ.2016.02.555597
Nishanthiny, S.C., M. Thushyanthy, T. Barathithasan and S. Saravanan. 2010. Irrigation water quality based on hydro chemical analysis, Jaffna, Sri Lanka. Am. Eurasian J. Agric. Environ. Sci., 7: 100-102.
Pervaiz, Z., S.S.H. Kazmi and K.H. Gill. 2003. Characterization of irrigation quality of ground water in Gujrat district. PJSS, 22: 48–54.
Qureshi, A.S., P.G. McCornick, A. Sarwar and B.R. Sharma. 2010. Challenges and prospects of sustainable groundwater management in the Indus Basin, Pakistan. Water Resour. Manag., 24: 1551–1569. Available at: https://digitalcommons.unl.edu/cgi/viewcontent.cgi?article=1011andcontext=wffdocs, https://doi.org/10.1007/s11269-009-9513-3
Riaz, U., Z. Abbas, Q. Zaman, M. Mubashir, M. Jabeen, S.A. Zulqadar, Z. Javeed, S. Rehman, M. Ashraf and M.J. Qamar. 2018. Evaluation of groundwater quality for irrigation purpose and effect on crop yields: A GIS based study of Bahawalpur. Pak. J. Agric. Res., 31(1): 29-36. https://doi.org/10.17582/journal.pjar/2018/31.1.29.36
Richards, L.A., 1954. Diagnosis and Improvement of Saline and Alkali Soils. USDA Handbook 60, Washington, D.C., USA. https://doi.org/10.1097/00010694-195408000-00012
Steel, R.G.D. and J.H. Torrie. 1980. Principles and procedures of statistics. 2nd Ed., McGraw-Hill Book Company, New York, USA.
UNDP, 2017. Implications for changes in water availability. In: The vulnerability of Pakistan’s water sector to the impacts of climate change: Identification of gaps and recommendations for action Pakistan.
To share on other social networks, click on any share button. What are these?