

Investigation on the Effect of Two Fat Metabolism Related Pathways on Intramuscular Fat Content in Pigs


Investigation on the Effect of Two Fat Metabolism Related Pathways on Intramuscular Fat Content in Pigs
Chaogang Yao, Daxin Pang, Chao Lu, Aishi Xu, Peixuan Huang, Hongsheng Ouyang* and Hao Yu*
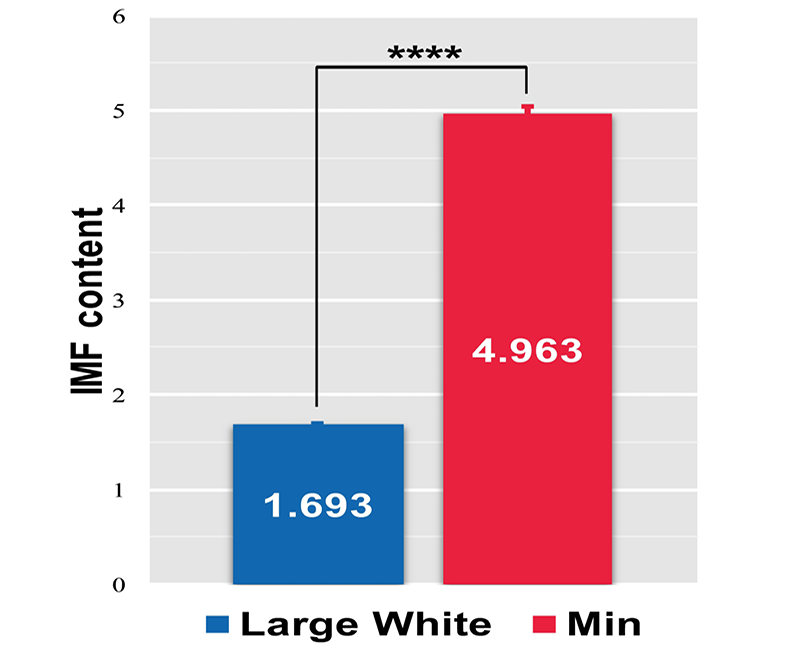
Detection of IMF content in LD muscles of Large White and Min pigs. Data represent means ± SEM (n=3), ****P < 0.0001.

qRT-PCR array results for the PPAR signaling pathway in two pig breeds. (A) A heatmap of all qRT-PCR array genes in the PPAR signaling pathway. The colors (blue, black, and red) represent the gene expression level in the LD of two pig breeds (Min and Large White). (B) Colored map of the PPAR signaling pathway. Upregulated and downregulated genes are colored in red and blue, respectively.

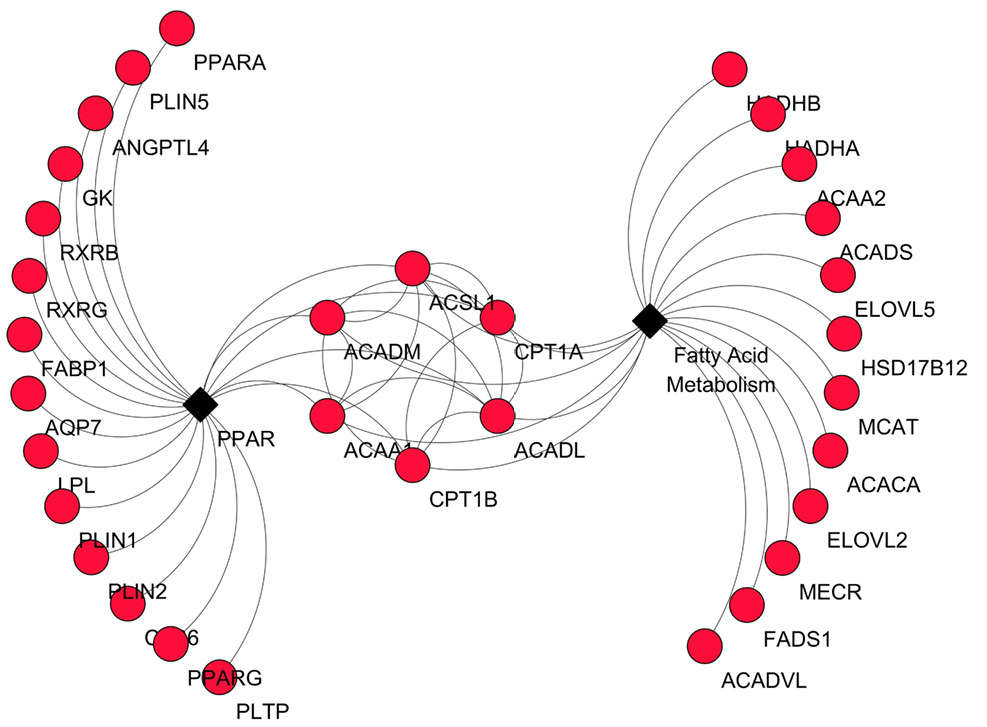
PPI network for the DEGs in the PPAR signaling pathway. Upregulated and downregulated genes are colored in red and blue, respectively. Node stands for the protein (gene); edge stands for the interaction of proteins(genes).

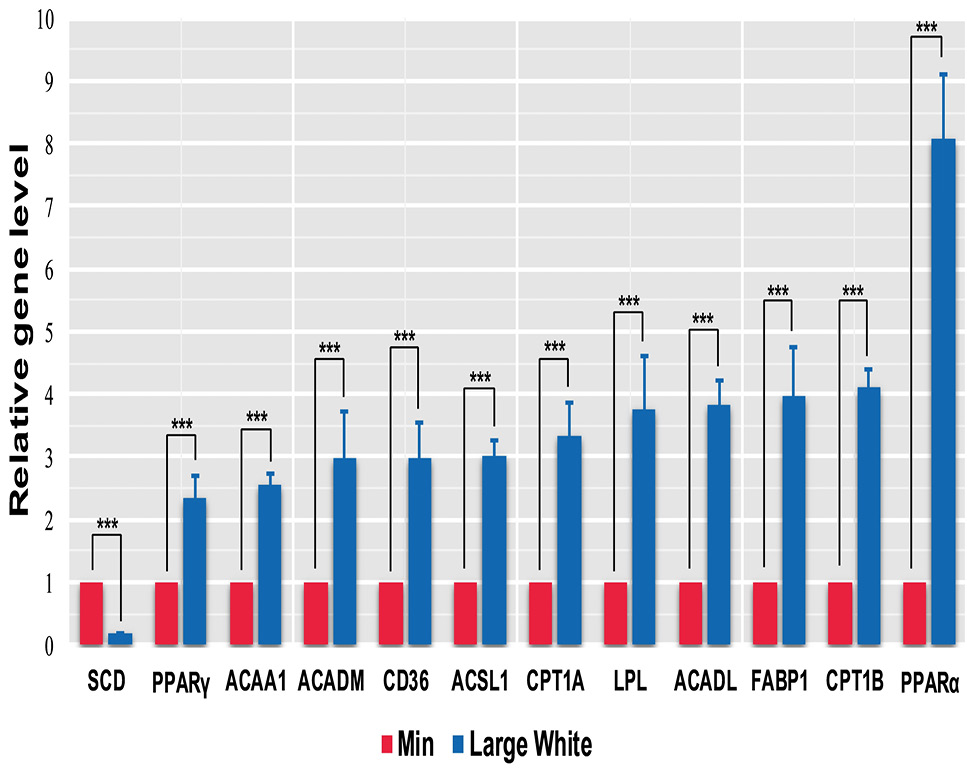
Comparisons of the expression levels of twelve key hub genes (PPARA, CD36, FABP1, LPL, ACSL1, CPT1A, CPT1B, ACAA1, ACADL, ACADM, PPARG and SCD) in the PPAR signaling pathway in the two pig breeds. A p value less than 0.05 and |logFold Change(FC)| ≥1 were regarded as the cutoff thresholds for DEGs. All data are shown as means ± SEM (n=3), ***P<0.001.

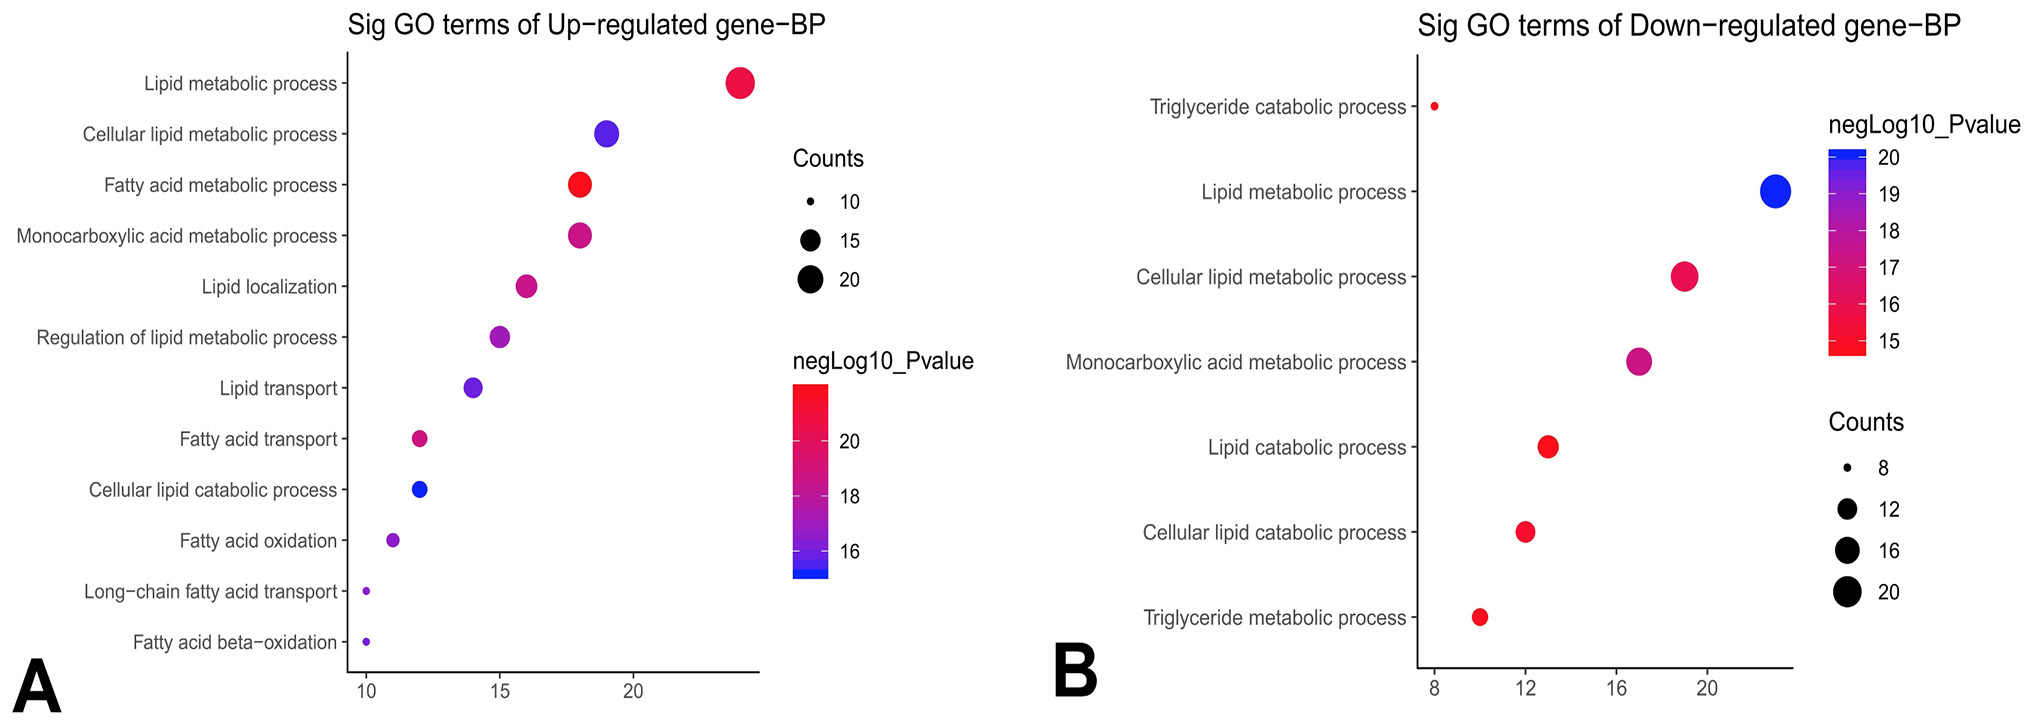
GO Biological Process (BP) enrichment of upregulated (A) and downregulated (B) genes in the PPAR signaling pathway.
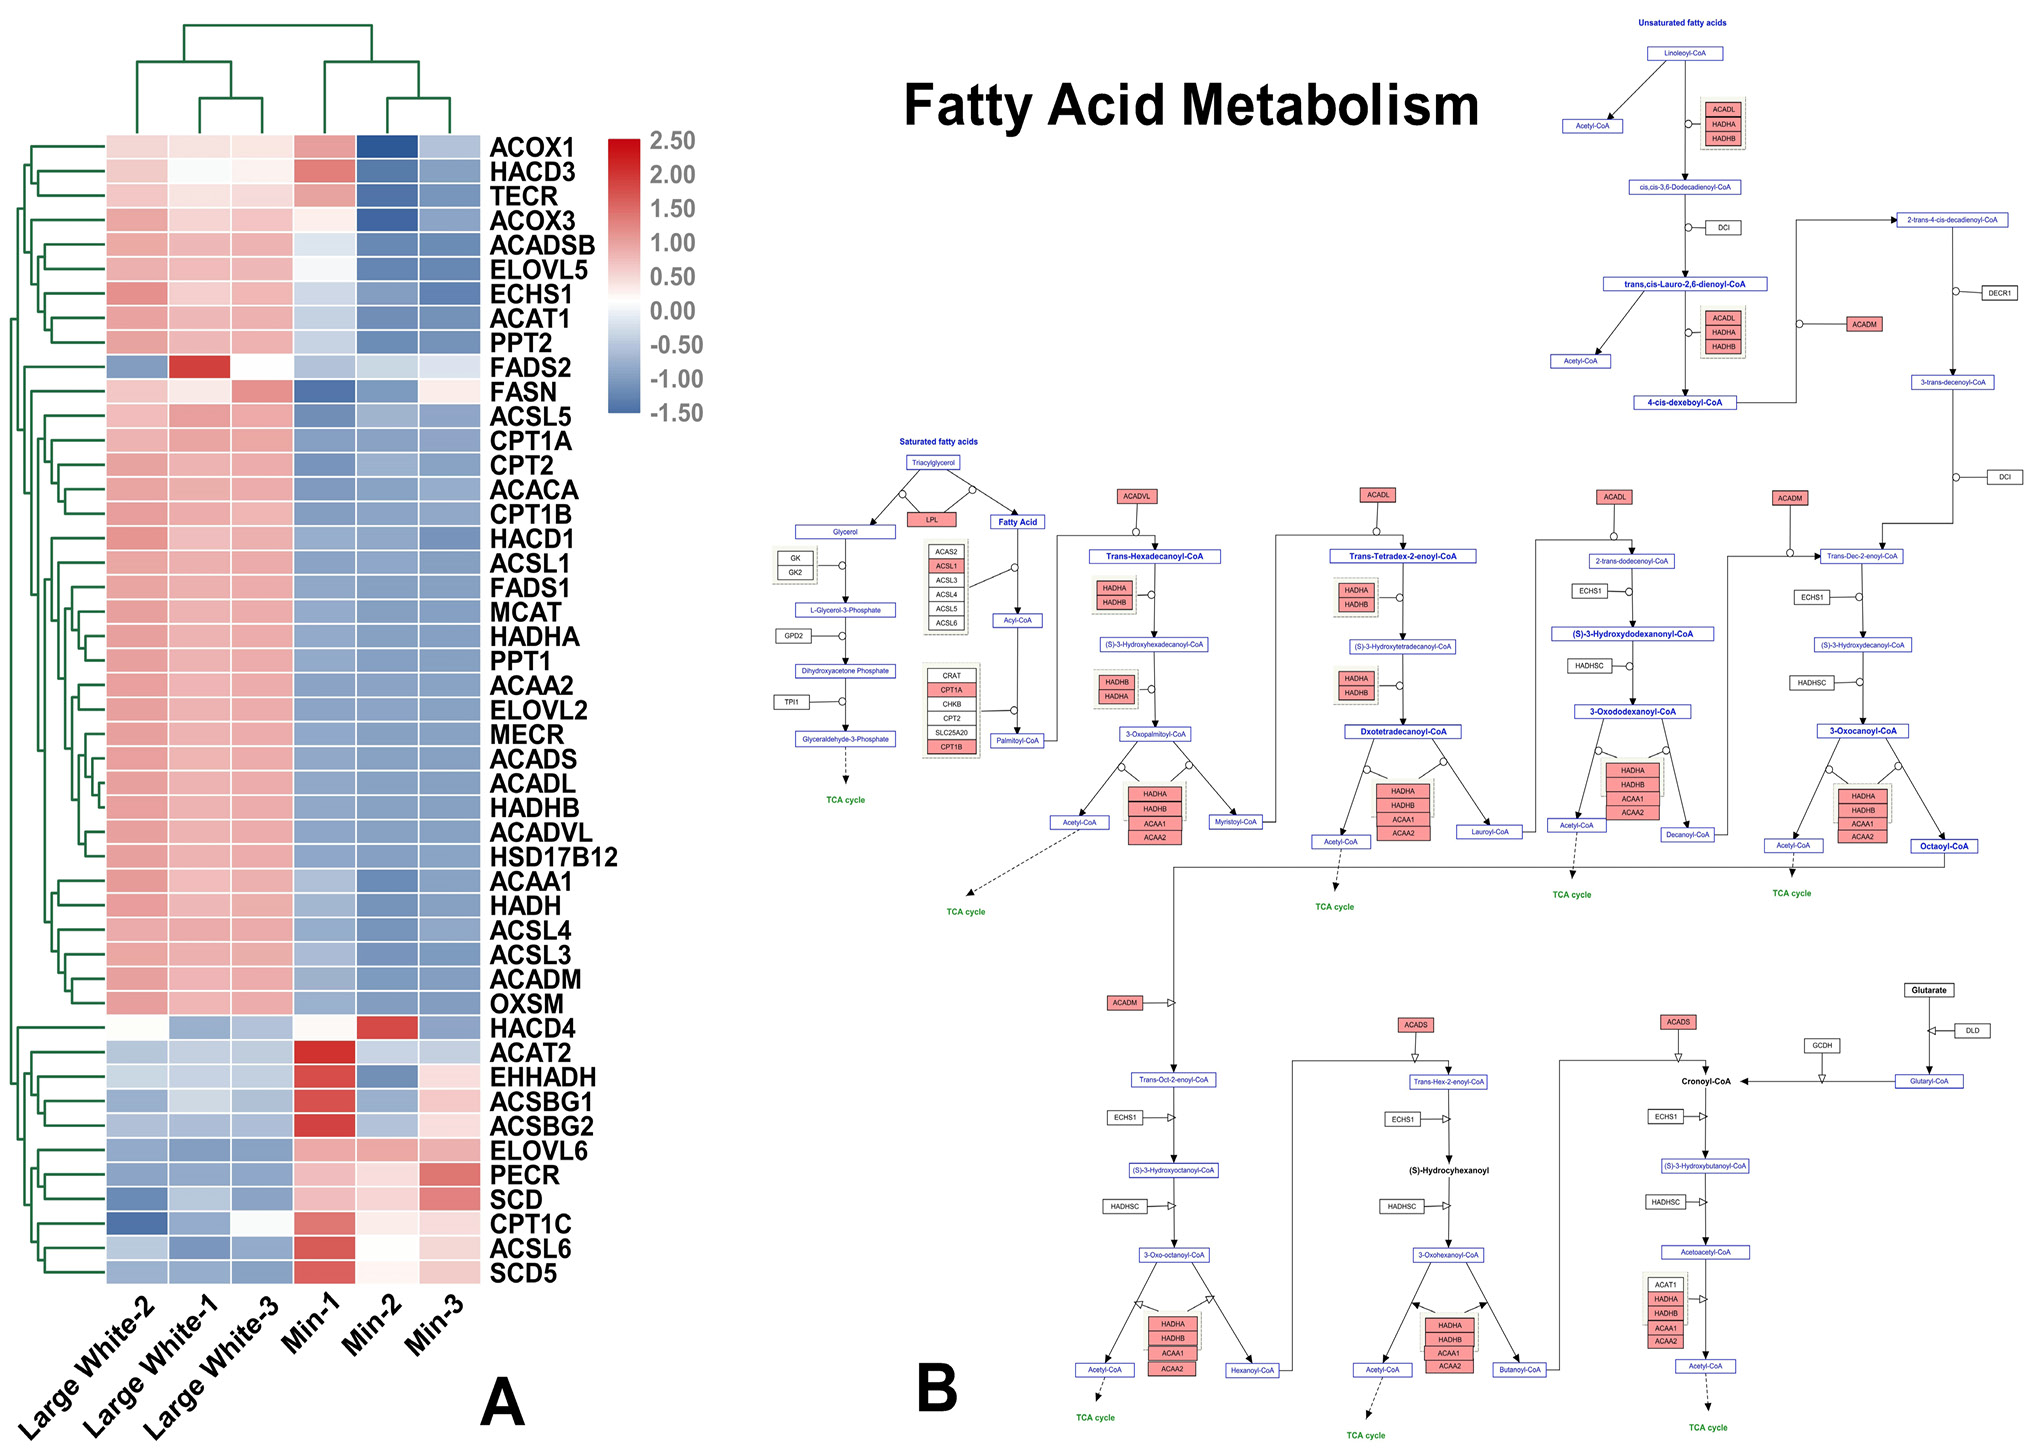
qRT-PCR array results for the fatty acid metabolism signaling pathway in two pig breeds. (A) A heatmap of all qRT-PCR array genes in the fatty acid metabolism signaling pathway. The colors (blue, black, and red) represent gene expression levels in the LD of two pig breeds (Min, and Large White); (B) Colored map of the fatty acid metabolism signaling pathway. Upregulated and downregulated genes are colored in red and blue, respectively.

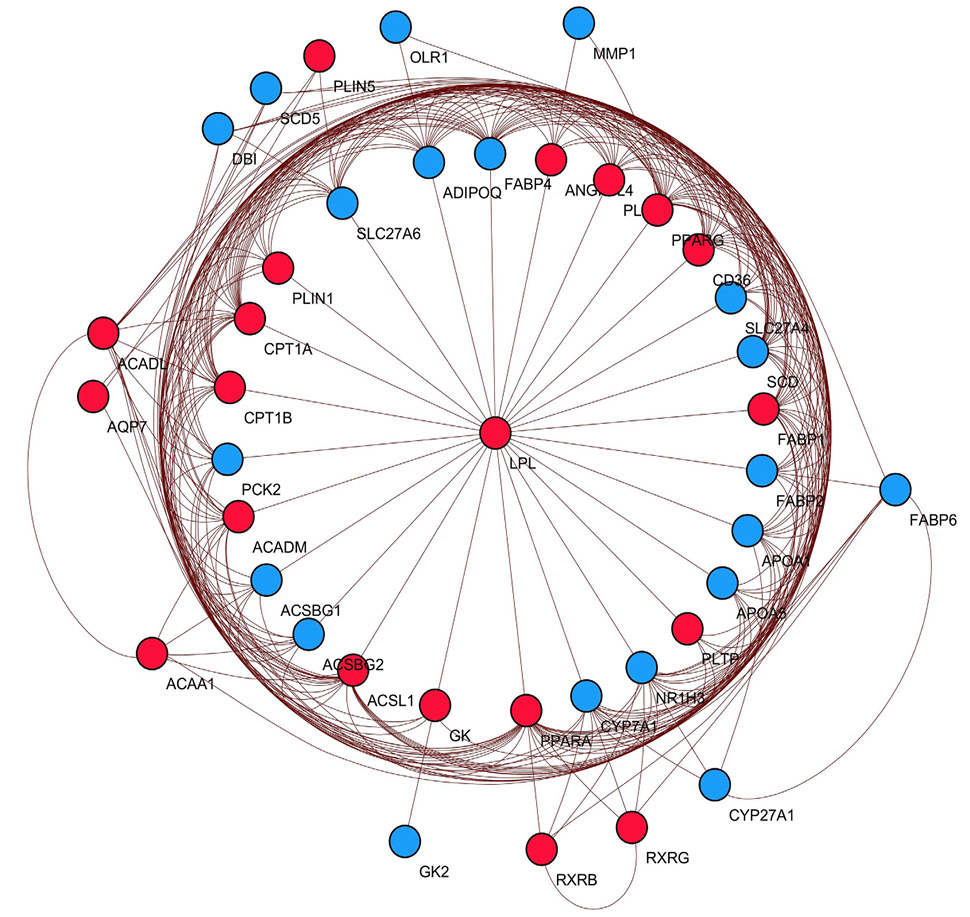
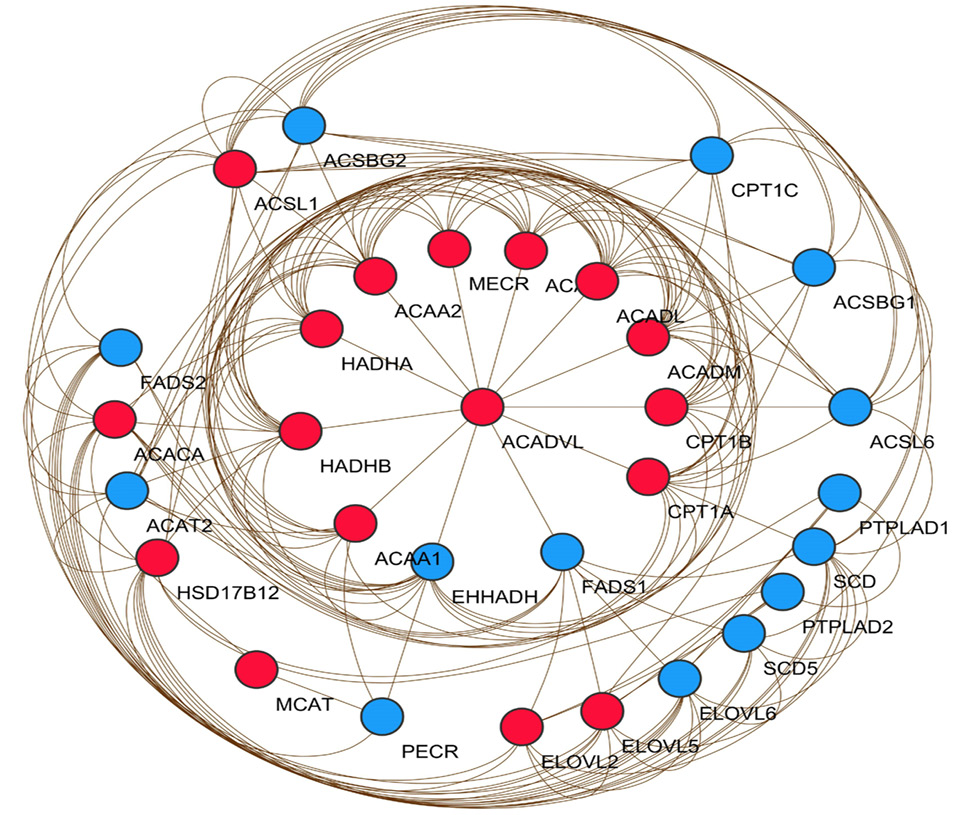
PPI network for the DEGs in the fatty acid metabolism signaling pathway. Upregulated and downregulated genes are colored in red and blue, respectively. Node stands for the protein (gene); edge stands for the interaction of proteins(genes).

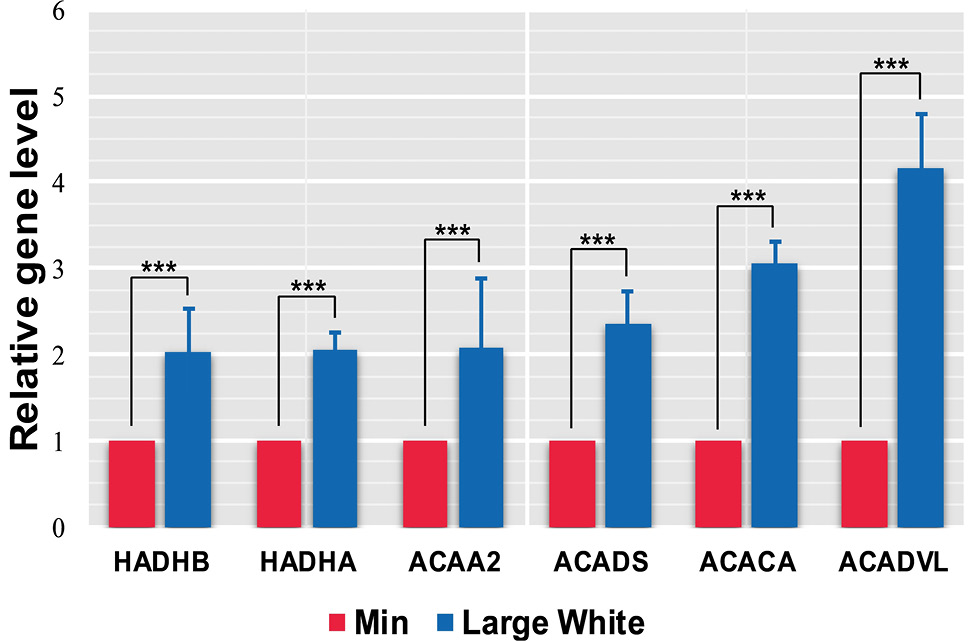
Comparisons of the expression levels of six key hub genes (ACACA, ACAA2, ACADS, ACADVL, HADHA and HADHB) in the fatty acid metabolism signaling pathway in the two pig breeds. A p value less than 0.05 and |logFold Change(FC)| ≥1 were regarded as the cutoff thresholds for DEGs. All data are shown as means ± SEM (n=3), ***P<0.001.

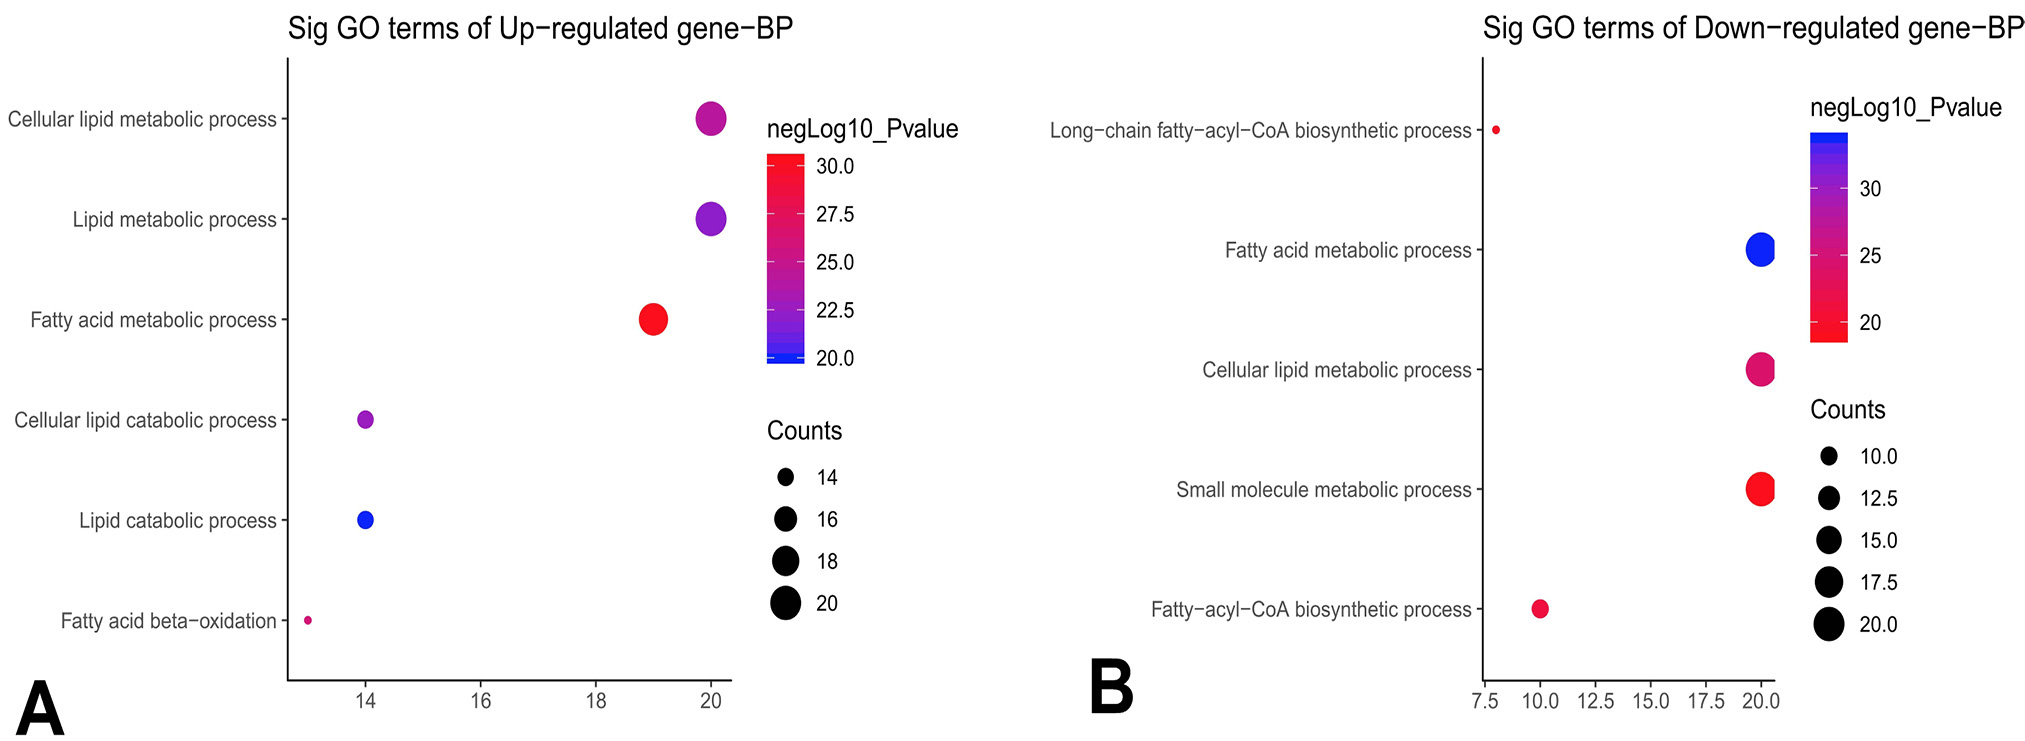
GO Biological Process (BP) enrichment of upregulated (A) and downregulated (B) genes in the fatty acid metabolism signaling pathway.

The upregulated genes shared by the PPAR and fatty acid metabolism signaling pathways.


