

Identification and Generation of Transgenic Mice and Goats with Capra hircus SCD1 Gene


Identification and Generation of Transgenic Mice and Goats with Capra hircus SCD1 Gene
Kai Jin1,2,3, Chen Chen 1,2,3, Xinyu Sun1,2,3, Caiye Zhu1,2,3, Mahmoud F. Ahmed1,2,3,4, Qisheng Zuo1,2,3, Jiuzhou Song4 and Bichun Li1,2,3*
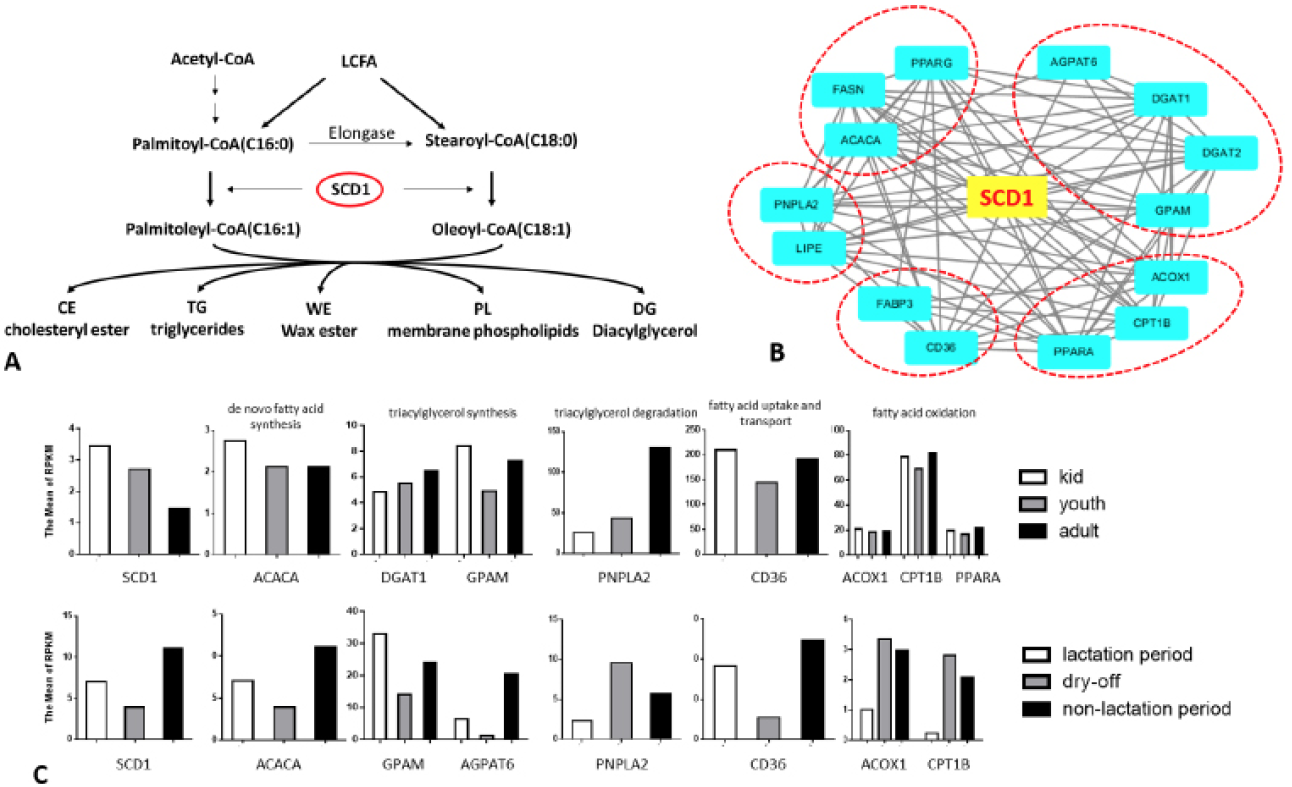
SCD1 and fat acid metabolism genes expression in goat. (A) Schematic diagram of SCD1 role in lipid synthesis. CE, cholesteryl esters; TG, triglycerides; WE, wax esters; PL, phospholipids; DG, diacylglycerol. (B) Effects of SCD1 on lipid accumulation and expression of genes related to lipid metabolism. (C) Variation of genes in lipid metabolism in mammary gland and muscular tissue at different developmental stages including de novo fat acid synthesis (FASN, ACACA, and PPARG), triacylglycerol synthesis (DGAT1, DGAT2, GPAM, AGPAT6, and LPIN1), triacylglycerol degradation (PNPLA2 and LIPE), fat acid uptake and intracellular transport (FABP3 and CD36), and fat acid oxidation (PPARA, ACOX1, and CPT1B) by RNA-seq.

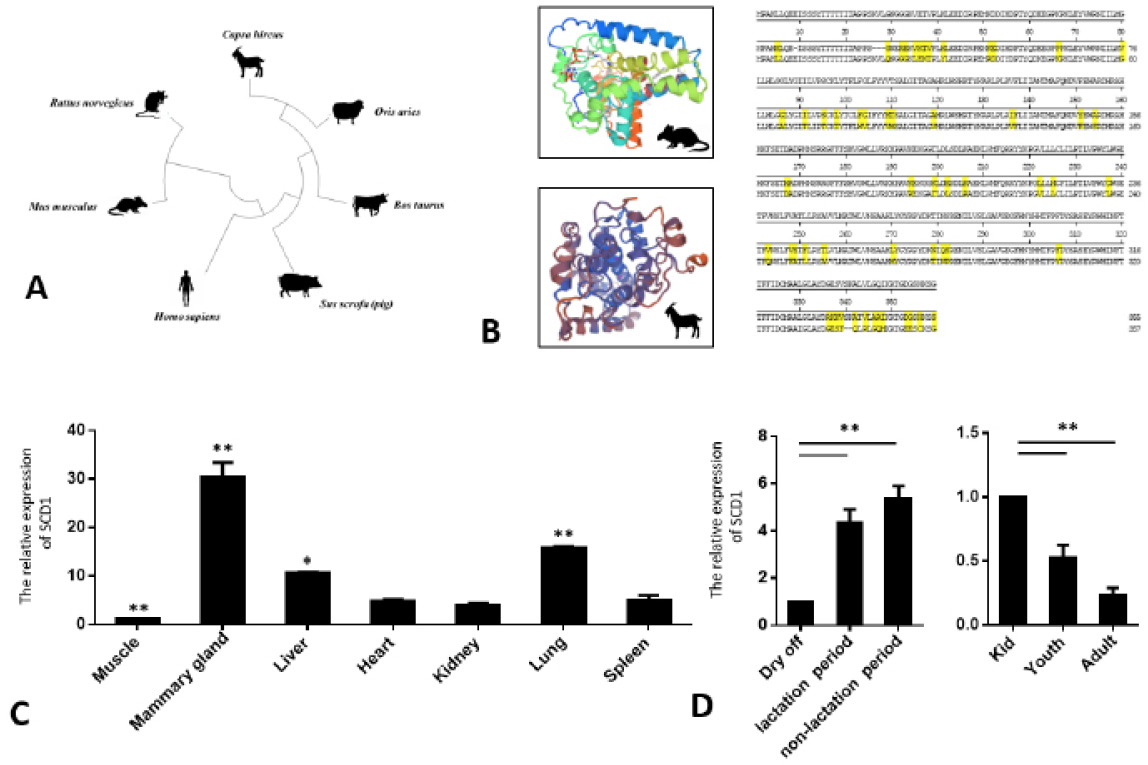
Xuhuai goat SCD1 was highly conserved and highly expressed in juvenile dorsal longissimus and lactating mammary gland tissue. (A) Phylogenetic relationships of SCD1. Cloned gene sequence was submitted to GenBank with numbers: Homo sapiens, Ovis aris, Capra hircus, Mus musculus, Rattus norvegicus, Suss crofa, and Bos taurus. Phylogenetic relationship of these sequences was estimated by neighbor-joining algorithm using PAM distances. Branch length is proportional to amount of evolution assumed to occur in each lineage. Numbers indicate the percentage of bootstrap replications that support each node. (B) Alignment of goat and mouse SCD1 protein structure, the different amino acid is yellow line. (C) SCD1 is more highly expressed in GOAT mammary gland, liver and lung, but low expressed in muscle. Error bars represent mean value ± SEM. (* p < 0.05, ** p < 0.01). (D) Expression of SCD1 increased significantly during lactation compared with the dry period in mammary gland and lamb during adult period in muscle. Quantitative PCR data were normalized to the dry period. Error bars represent mean value ± SEM. (* p < 0.05, ** p < 0.01).

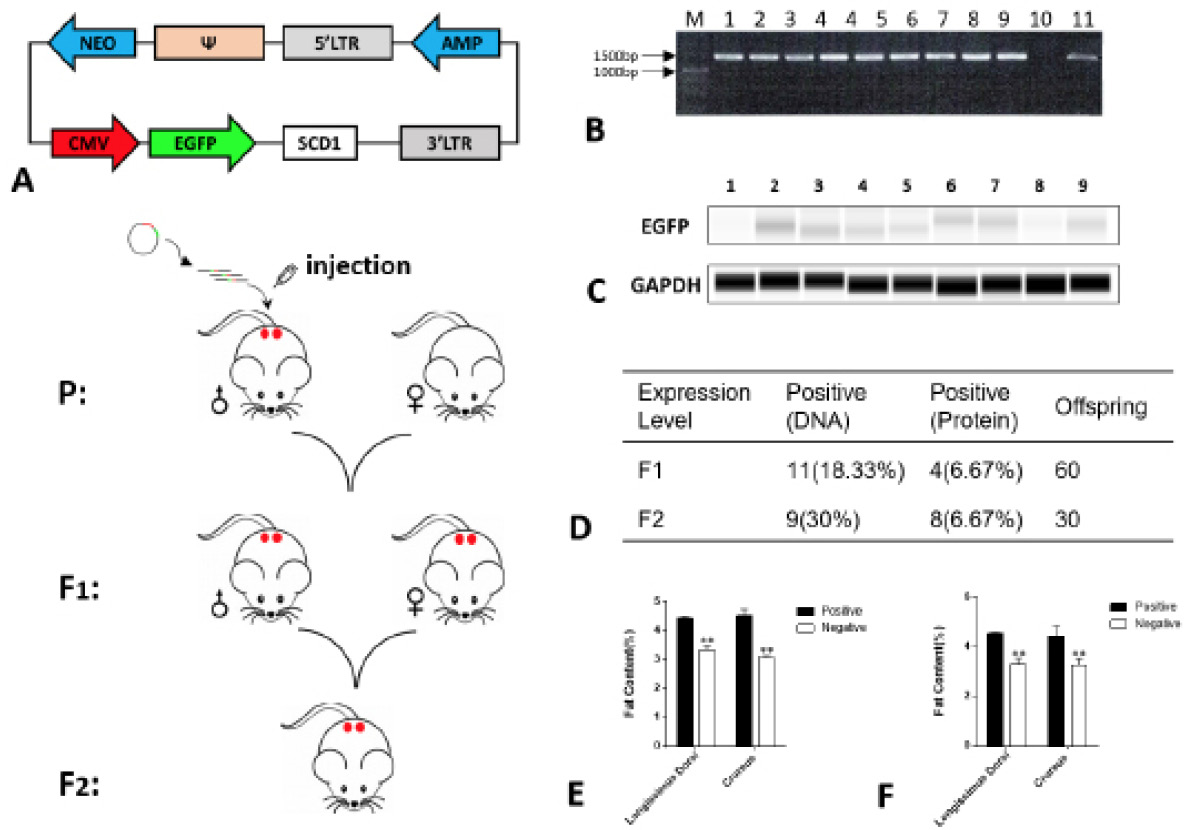
Establishment of transgenic mice and stable inheritance. (A) Protocol for transgenic mice generation. The healthy adult male mice were chosen for testicle injection, and after 5 days one treated male and three healthy non-pregnant adult female mice were put in one cage. The resulting positive F1 males were mated with female mice after sexual maturity to produce F2 generation. (B) DNA PCR assay of F1 generation tail tissue. M: DL5000bp marker; 1-9, experimental group; 10: negative control; 11: positive control. (C). Western blot assay results of F1 generation. 1-9: the experimental group. (D). Number of F1 and F2 with SCD1 expression in transgenic mice. (E). Expression of SCD1 increased significantly in longissimus dorsi and crureus of F1 transgenic mice. Error bars represent mean value ± SEM. (* p < 0.05, ** p < 0.01).(F). Expression of SCD1 increased significantly in Longissimus dorsi and Crureus of F2 transgenic mice. Error bars represent mean value ± SEM. (* p < 0.05, ** p < 0.01).
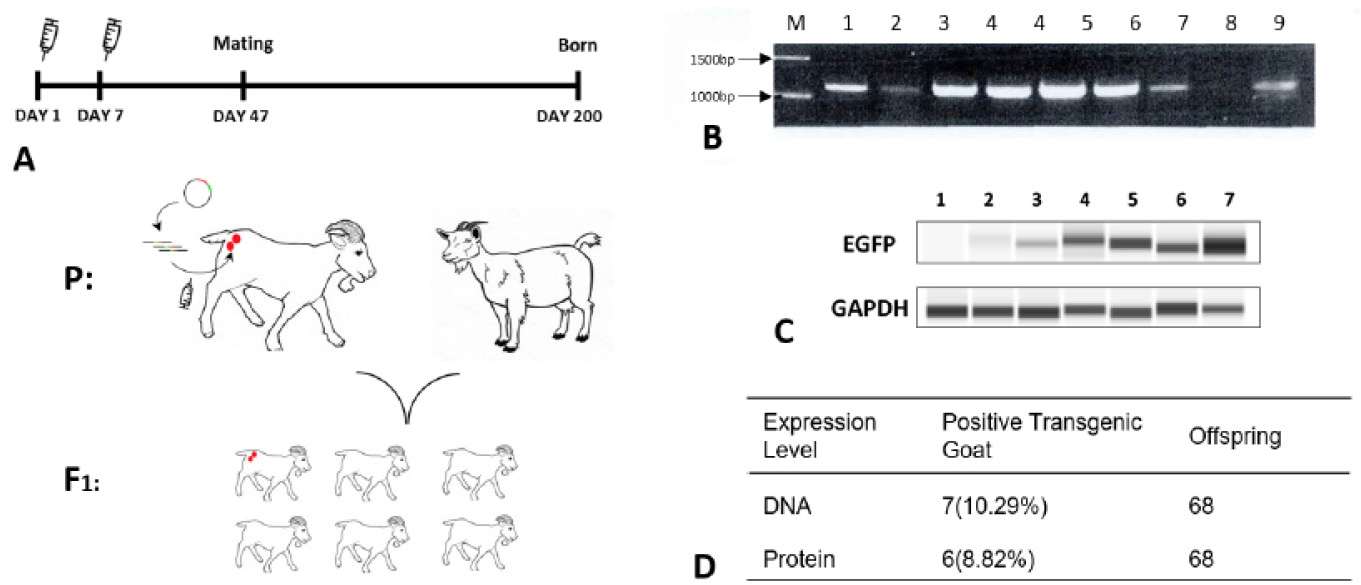
Identication and generation of transgenic goat. (A) Protocol for transgenic goat production. The healthy adult male goat were chosen for testicle injection twice, and after 47 days, one treated male and three healthy non-pregnant adult female goat were mated to produce F1 generation. (B) DNA PCR assay of tail tissue in F1 generation. M, DL5000 bp marker; 1-7, experimental postive group; 8, negative control; 9, positive control. (C) Western blot assay results of F1 generation. 1-7, the experimental group. (D) Number of transgenic F1 goat with SCD1 expression.


